

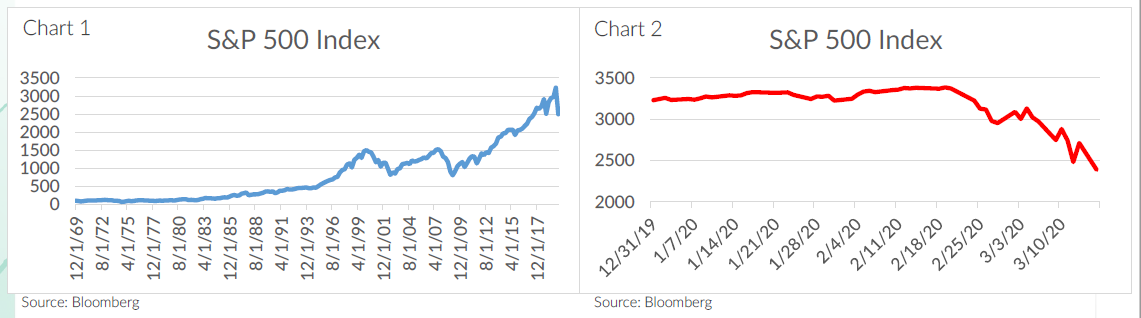
As a Behavioral Finance Professor from Duke University and CIO of the firm I think it makes sense to take a break from the virus news and the first official “bear” market since 2008 and consider the two charts below. The first is a long-term chart of the S&P 500. In the context of an investor with a long-term plan, every decline looks just like a blip on the radar. But the chart next to it reflects the history-making decline in equities over the last two weeks. Looking with hindsight, every bear market was a buying opportunity. But during market declines, investors aren’t reacting to or seeing what is in the first chart, they are panicking over what is in the second one.
They aren’t feeling the small blip in the much bigger picture. They are feeling the major pain that goes with their hard-earned money being perceived as “lost.”
That construct is one of the most important in behavioral finance: you don’t “lose” anything if you don’t panic and sell a diversified strategy. If we could convince Advisors and their Clients that the proper terminology is “the current market value of my portfolio has declined,” we and they would be on so much better footing and higher ground than we are now. That latter phrase introduces the concept of time (current vs. long term) and the notion that a “portfolio” constitutes a long-term plan.
Part of our confidence in the process is that we are committed as a firm in our Power Products and in the GT Portfolio Suite to manage drawdown and recession-risks—we have already eliminated high yield and emerging market bonds in the GT Suite, and will continue to look to de-risk as we assess a longer virus-induced slowdown and continued high volatility. In our Power solutions, most have already triggered out of most equity or credit risk or are in process. If this market gets worse, we expect that our Strategies will look very good—if Advisors hold on.
In fact, this is what is most puzzling when Advisors panic like those we saw this week over Power Income’s/GTI short term performance. Presumably one invests in PI/GTI because they want enough income to cover inflation (which that portfolio has done for a number of years). Further, Advisors must understand and embrace that in the post-2008 world of negative real rates, it requires an adjustment in the risk levels. For PI/GTI, the goal is mid-high single digit returns with low-mid single digit standard deviation. It also means that that there will be short intervals where we will potentially experience high single digit declines, not losses. Remember that a decline in market value doesn’t become a realized loss unless you sell. Similarly, GTA is constructed for high single digit to mid teen returns with single digit standard deviation, and annual losses should potentially cap out in the high teens range during a recession.
Ultimately clients are seeking total return and cashflow. We believe that mitigating downside risk is important but also believe equally that participating in income to be prudent as well. Currently, the solution is yielding in the 3.5% range. We see meaningful opportunities in the future with areas that have pulled back offering attractive yields.
I recognize that it is very easy for me as a practicing behavioral economist and for us in our Firm who construct, manufacture and offer these investment portfolios to say “stay the course, we’ll handle the risk management” –it is second nature for us to live in an emotion free investing world. For us, all that matters are our data, our research, our ability to stay with our process and the 100% certainty world that recessions and bear markets always end (the shorter the better for both!).
This vicious decline we are in now may get worse before it gets better. Even so, it won’t make the advice to stay the course any less valuable. The reality is that none of us know when this or any other decline will end. But either way, it is important to acknowledge that advice to stay the course can look pretty dumb when it is given well before the bottom ends up coming. It isn’t intended as a prediction that the worst is over, though. It is more an acknowledgement that there is no way to predict that in advance, so enduring the pain is the strategy with the highest probability of long-term success. It is important to note that no one can with precision call every market bottom or top. It is common for individual investors and even advisors to get caught up in the psychology or panic of the markets and sell at a or near a bottom, ultimately reinvesting at a higher level missing much of a market recovery.
And that’s the real message here: What really kill long-term returns are binary, psychologically driven decisions made in high stress situations. Cashing out a portfolio in early 2009, after the market had dropped by nearly 50%, is a great example of this type of thing. And yet, that’s exactly what around 75% of individual investors did, and 40% of them missed that great bull market entirely. We believe that the next few months are a great time to buy our diversified and blended portfolios and funds. History and certainty are on our side, even if it doesn’t “feel” like it currently.
With this month’s positioning, we recognized that credit and financial conditions have continued to deteriorate, and we took steps to de-risk our portfolios; we sold our emerging market bonds and short-term high yield bonds to raise cash equivalents. We remain constructive on risk assets longer term, (particularly after the depth and swiftness of the recent decline) but are cautious to extreme levels of volatility and uncertainty in the near-term. We will continue to be data dependent and evaluate further changes in positioning. While plenty of bad news is already “priced in”, we remain cautious to more pain ahead in the near-term. Further, market volatility creates investment opportunities and we are diligently monitoring investment choices for the next wave higher.
Finally, know that our all our Strategies will adapt to fundamental or rules-based, not emotional influences. We seek opportunities for solid risk adjusted returns and to preserve capital in risk downturns.
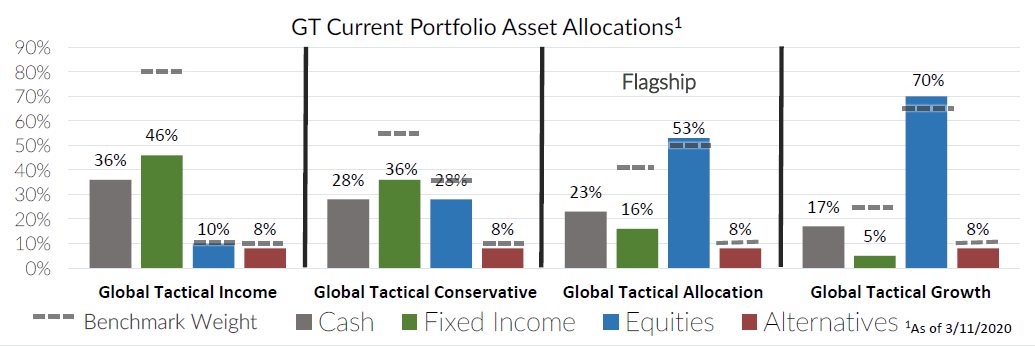
Recent Portfolio Changes
We exited our positions in emerging market bonds and short-term high yield bonds to raise cash equivalents. We took steps to de-risk our portfolios amid unprecedented volatility and deteriorating financial conditions.
Please do not hesitate to contact our team with any questions. You can get more information by calling (800) 642-4276 or by emailing AdvisorRelations@donoghue.com. Also, visit our Contact Page to learn more about your territory coverage.
Best regards,

John A. Forlines, III
1 Information as of 3/11/2020. Individual account allocations may differ slightly from model allocations
2 Contains international exposure
Past performance is no guarantee of future results. The material contained herein as well as any attachments is not an offer or solicitation for the purchase or sale of any financial instrument. It is presented only to provide information on investment strategies, opportunities and, on occasion, summary reviews on various portfolio performances. The investment descriptions and other information contained in this Markets in Motion are based on data calculated by W.E. Donoghue & Co., LLC (W.E. Donoghue) and other sources including Morningstar Direct. This summary does not constitute an offer to sell or a solicitation of an offer to buy any securities and may not be relied upon in connection with any offer or sale of securities.
The views expressed are current as of the date of publication and are subject to change without notice. There can be no assurance that markets, sectors or regions will perform as expected. These views are not intended as investment, legal or tax advice. Investment advice should be customized to individual investors objectives and circumstances. Legal and tax advice should be sought from qualified attorneys and tax advisers as appropriate.
The JAForlines Global Tactical Allocation Portfolio composite was created July 1, 2009. The JAForlines Global Tactical Income Portfolio composite was created August 1, 2014. The JAForlines Global Tactical Growth Portfolio composite was created April 1, 2016. The JAForlines Global Tactical Conservative Portfolio composite was created January 1, 2018.
Results are based on fully discretionary accounts under management, including those accounts no longer with the firm. Individual portfolio returns are calculated monthly in U.S. dollars. Policies for valuing portfolios and calculating performance are available upon request. These returns represent investors domiciled primarily in the United States. Past performance is not indicative of future results. Performance reflects to re-investment of dividends and other earnings.
Net returns are presented net of management fees and include the reinvestment of all income. Net of fee performance was calculated using a model fee of 1% representing an applicable wrap fee. The investment management fee schedule for the composite is: Client Assets = All Assets; Annual Fee % = 1.00%. Actual investment advisory fees incurred by clients may vary.
W.E. Donoghue & Co., LLC (Donoghue) claims compliance with the Global Investment Performance Standards (GIPS®).
The Blended Benchmark Moderate is a benchmark comprised of 50% MSCI ACWI, 40% Bloomberg Barclays Global Aggregate, and 10% S&P GSCI, rebalanced monthly.
The Blended Benchmark Conservative is a benchmark comprised of 35% MSCI ACWI, 55% Bloomberg Barclays Global Aggregate, and 10% S&P GSCI, rebalanced monthly.
The Blended Benchmark Growth is a benchmark comprised of 65% MSCI ACWI, 25% Bloomberg Barclays Global Aggregate, and 10% S&P GSCI, rebalanced monthly.
The Blended Benchmark Income is a benchmark comprised of 80% Bloomberg Barclays Global Aggregate Bond Index, 10% MSCI ACWI, and 10% S&P GSCI, rebalanced monthly.
The MSCI ACWI Index is a free float adjusted market capitalization weighted index that is designed to measure the equity market performance of developed and emerging markets. The S&P GSCI® is a composite index of commodity sector returns representing an unleveraged, long-only investment in commodity futures that is broadly diversified across the spectrum of commodities. The Bloomberg Barclays Global Aggregate Index is a flagship measure of global investment grade debt from twenty-four local currency markets. This multi-currency benchmark includes treasury, government-related, corporate and securitized fixed-rate bonds from both developed and emerging markets issuers.
Index performance results are unmanaged, do not reflect the deduction of transaction and custodial charges or a management fee, the incurrence of which would have the effect of decreasing indicated historical performance results. You cannot invest directly in an Index. Economic factors, market conditions and investment strategies will affect the performance of any portfolio, and there are no assurances that it will match or outperform any particular benchmark.
Policies for valuing portfolios, calculating performance, and preparing compliant presentations are available upon request. For a compliant presentation and/or the firm’s list of composite descriptions, please contact 800‐642‐4276 or info@donoghue.com.
W.E. Donoghue is a registered investment adviser with United States Securities and Exchange Commission in accordance with the Investment Advisers Act of 1940.