
Concerns about higher than expected inflation have weighed on investors over the past few months. In our March Markets in Motion, we discussed our view that structurally higher inflation is not a near term risk. This month, we’d like to elaborate further on that view and add nuance because we believe that the data will be a bit noisy over the coming months.
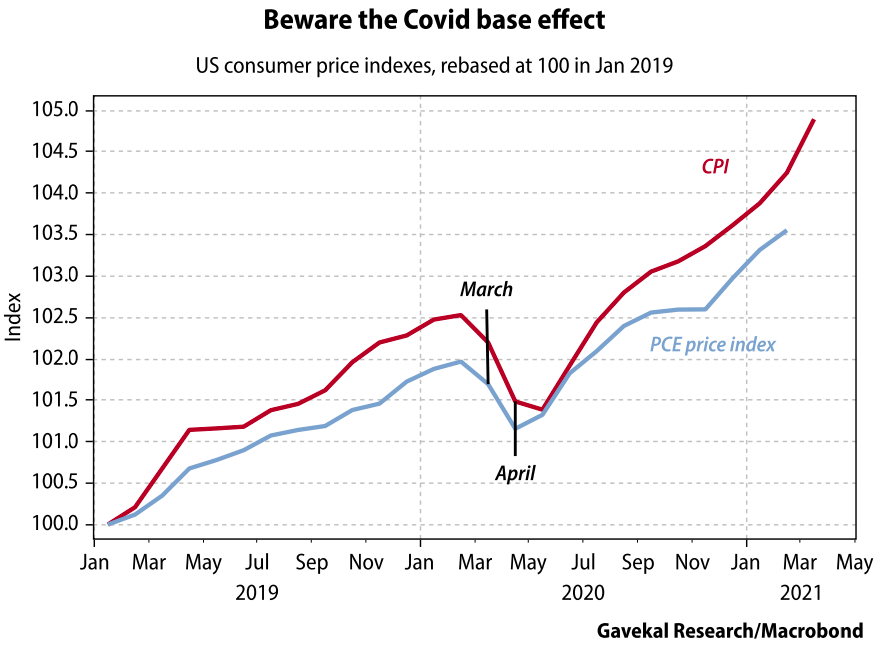
First, US consumer price inflation is trending up. Headline CPI rose 2.6% year-over-year in March, from 1.7%. It’s the first time it has exceeded the US central bank’s 2% inflation target since Covid struck. But base effects are a big part of the story. CPI plunged during last spring’s lockdowns, resulting in a significant base effect for March, which will only get stronger in April and May. So, the next few months’ data should continue to accelerate.
This is not surprising … expansionary factors like fast money supply growth (stimulus) and stronger demand (re-opening) are driving up prices. But with investor inflation expectations at/near all-time highs, we believe these current inflationary dynamics are already priced into markets. For example, 10-year treasury yields closed 5 bps lower on the day of the “blowout” CPI report. And reflation assets have been outperforming since September.
Moreover, a transitory pickup in inflation is a policy goal of the Federal Reserve. We believe the real risk to markets would be a more hawkish central bank. But we do not expect data over the next few months will make them flinch and future moves will continue to be dictated by labor market dynamics (which are a long way from normalization).
Finally, after a transitory pickup in inflation, we believe structural deflationary trends will reassert themselves. Technology continues to produce more (and better) goods & services at a lower cost while suppressing workers’ wages at the same time. Globalization and free trade (global and domestic) allows bigger labor pools to be utilized, leading to the production of more goods at a lower cost. And the pandemic accelerated structural low end job losses and already plunging global birth rates.
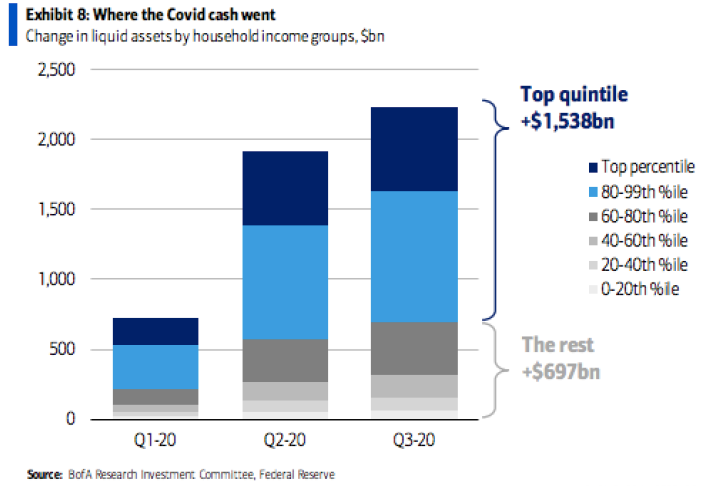
While structural deflation will continue to ease cost pressures, we believe that the biggest deterrent to near-term inflation will be inequality. Inflation bulls point to the >$2T extra cash in household accounts from post-Covid stimulus. But we believe this data is skewed, because ~70% of this cash has gone to the top 20%, which is always the group least likely to spend. Therefore, much of the extra cash will be saved and not unleashed into the economy. That’s why a savings glut on the balance sheets of already-wealthy households is unlikely to boost inflation in a sustained way.
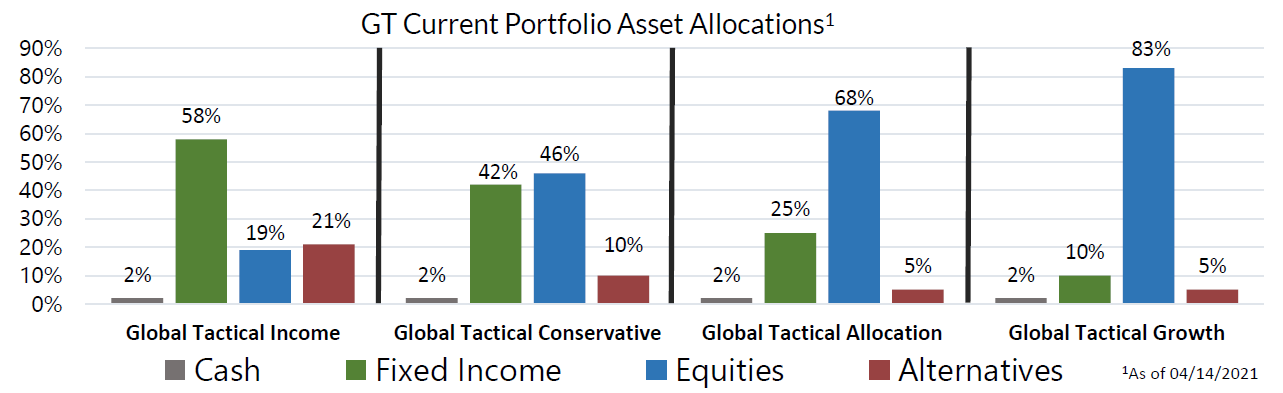
Thus, we see a “goldilocks” environment for risk assets – where growth is strong, inflation is contained and monetary policy is accommodative. We continue to overweight stocks and credit over government bonds.
With this month moves, we sold our tactical position in treasuries and consolidated our equity book, adding to our international exposure.
Finally, know that all our Strategies will adapt to fundamental or rules-based, not emotional influences. We seek opportunities for solid risk adjusted returns and to preserve capital in asset market downturns.
1 Information as of 03/02/2021. Individual account allocations may differ slightly from model allocations.
Recent Portfolio Changes
We exited a tactical position in US treasuries and consolidated our equity allocation, ultimately adding to our equity exposure. We exited our tactical position in US treasuries after rate volatility subsided. We sold two equity positions in infrastructure and EAFE to add exposure to US value, global clean energy, and international free cash flow.
1 Information as of 03/02/2021. Individual account allocations may differ slightly from model allocations
We invite you to join a webinar (today, April 28th, 4:00pm EDT), First Quarter 2021 Review of our Global Tactical Allocation Portfolios. You can get more information by calling (800) 642-4276 or by emailing AdvisorRelations@donoghueforlines.com. Also, visit our Sales Team Page to learn more about your territory coverage.
John A. Forlines III
Chief Investment Officer
Past performance is no guarantee of future results. The material contained herein as well as any attachments is not an offer or solicitation for the purchase or sale of any financial instrument. It is presented only to provide information on investment strategies, opportunities and, on occasion, summary reviews on various portfolio performances. The investment descriptions and other information contained in this Markets in Motion are based on data calculated by Donoghue Forlines LLC and other sources including Morningstar Direct. This summary does not constitute an offer to sell or a solicitation of an offer to buy any securities and may not be relied upon in connection with any offer or sale of securities.
The views expressed are current as of the date of publication and are subject to change without notice. There can be no assurance that markets, sectors or regions will perform as expected. These views are not intended as investment, legal or tax advice. Investment advice should be customized to individual investors objectives and circumstances. Legal and tax advice should be sought from qualified attorneys and tax advisers as appropriate.
The Donoghue Forlines Global Tactical Allocation Portfolio composite was created July 1, 2009. The Donoghue Forlines Global Tactical Income Portfolio composite was created August 1, 2014. The Donoghue Forlines Global Tactical Growth Portfolio composite was created April 1, 2016. The Donoghue Forlines Global Tactical Conservative Portfolio composite was created January 1, 2018.
Results are based on fully discretionary accounts under management, including those accounts no longer with the firm. Individual portfolio returns are calculated monthly in U.S. dollars. These returns represent investors domiciled primarily in the United States. Past performance is not indicative of future results. Performance reflects the re-investment of dividends and other earnings.
Net returns are presented net of management fees and include the reinvestment of all income. Net of fee performance was calculated using a model fee of 1% representing an applicable wrap fee. The investment management fee schedule for the composite is: Client Assets = All Assets; Annual Fee % = 1.00%. Actual investment advisory fees incurred by clients may vary.
The Donoghue Forlines Global Tactical Allocation Benchmark is the HFRU Hedge Fund Composite. The HFRU Hedge Fund Composite USD Index is designed to be representative of the overall composition of the UCITS-Compliant hedge fund universe. It is comprised of all eligible hedge fund strategies; including, but not limited to equity hedge, event driven, macro, and relative value arbitrage.
The Blended Benchmark Conservative is a benchmark comprised of 80% HFRU Hedge Fund Composite and 20% Bloomberg Barclays Global Aggregate, rebalanced monthly.
The Blended Benchmark Growth is a benchmark comprised of 80% HFRU Hedge Fund Composite and 20% MSCI ACWI, rebalanced monthly. The Blended Benchmark Income is a benchmark comprised of 60% HFRU Hedge Fund Composite and 40% Bloomberg Barclays Global Aggregate, rebalanced monthly.
The MSCI ACWI Index is a free float adjusted market capitalization weighted index that is designed to measure the equity market performance of developed and emerging markets. The HFRU Hedge Fund Composite USD Index is designed to be representative of the overall composition of the UCITS-Compliant hedge fund universe. It is comprised of all eligible hedge fund strategies; including, but not limited to equity hedge, event driven, macro, and relative value arbitrage. The underlying constituents are equally weighted. The Bloomberg Barclays Global Aggregate Index is a flagship measure of global investment grade debt from twenty-four local currency markets. This multi-currency benchmark includes treasury, government-related, corporate and securitized fixed-rate bonds from both developed and emerging markets issuers.
Index performance results are unmanaged, do not reflect the deduction of transaction and custodial charges or a management fee, the incurrence of which would have the effect of decreasing indicated historical performance results. You cannot invest directly in an Index. Economic factors, market conditions and investment strategies will affect the performance of any portfolio, and there are no assurances that it will match or outperform any particular benchmark.
Policies for valuing portfolios, calculating performance, and preparing compliant presentations are available upon request. For a compliant presentation and/or the firm’s list of composite descriptions, please contact 800‐642‐4276 or info@donoghueforlines.com.
Donoghue Forlines is a registered investment adviser with United States Securities and Exchange Commission in accordance with the Investment Advisers Act of 1940. Registration does not imply a certain level of skill or training.