

Since our last Markets in Motion, our Global Macro view has begun to playout. Since mid-May, growth/quality equities have turned from laggards to leaders as cyclical assets have faltered. We think this move has only just begun and we remain convicted in our positioning.
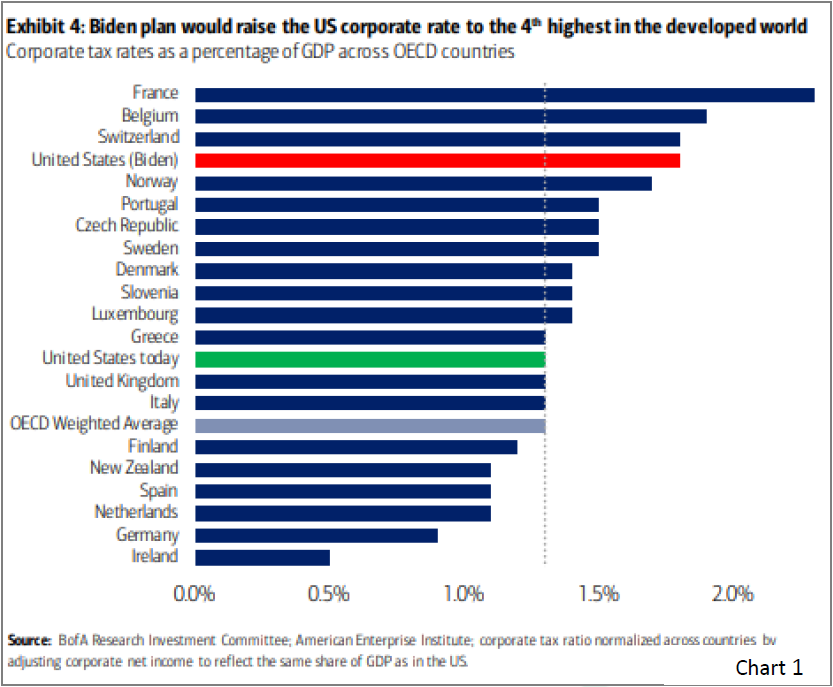
This month, we wanted to address a question that frequently comes up in client conversations. With the Biden administration proposing $3.3tn in new taxes (Chart 1), will this stymie the new bull market in risk assets?
Over the past 20 years, successive administrations have failed to raise taxes by enough to finance increased spending -driving the federal budget deficit higher relative to GDP. The COVID-19 pandemic exacerbated the problem, blowing out the deficit to record peacetime levels. This has not caused any major financial problems because low (and falling) interest rates have helped contain debt servicing costs, and the Fed has been a large buyer of treasuries (effectively monetizing the debt). However, given the long run path of fiscal finances and the Biden administration’s ambitious spending plans with a majority in Congress, we feel higher taxes are inevitable.
The Biden tax plan has two major provisions to corporations and households that we believe will more than likely get passed. All other major tax proposals, such as eliminating favorable treatment for qualified dividends and capital gains, appear to lack significant support.
- Corporate: Raising the domestic corporate income tax rate from 21% to 28%. Thiswould bring the tax rate halfway back to where it was prior to the Trump tax cuts(35%). Likely to be negotiated down to 25%. (Chart 1).
- Households: Raising the top income tax bracket to 39.6% from 37%. Where the ratewas prior to Trump Tax cuts.
As a result of these two major provisions, corporate profits will decline, activity will slow, and higher income taxes will mean less investable cash. The top 1% of income earners own 43% of household US equity ownership, the highest concentration on record.
All things equal, this is bearish for risk assets. But the world does not exist in a vacuum! All things are not equal and the bullish effects of the new framework for fiscal spending will help offset the negative impact of higher taxes. Additionally, as we’ve highlighted in the past, business cycle dynamics are more important than the market narrative du jour – and the macro is currently robust.
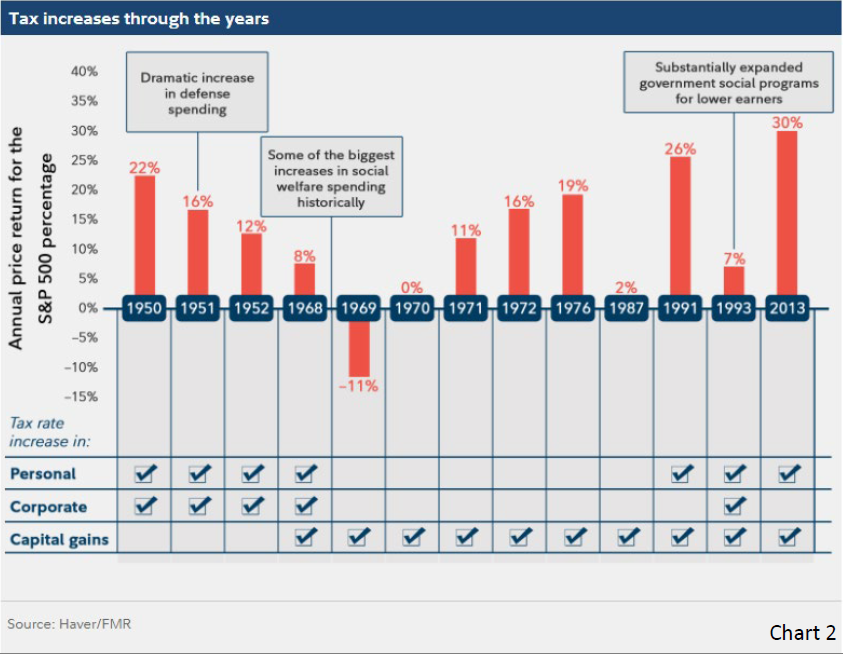
And history is on our side (Chart 2): In the 13 previous instances of tax increases just since 1950, the S&P 500 has shown higher average returns, and higher odds of an advance, in times when taxes are increasing.
While this seems counterintuitive and correlation does not equal causation, it suggests other factors carry more importance and for the most part, tax hikes get discounted into markets in advance.
Therefore, investors are likely to shrug off the near-term impact of higher taxes, given strong economic growth and continued support from accommodative monetary policy.
Finally, know that all our Strategies will adapt to fundamental or rules-based, not emotional influences. We seek opportunities for solid risk adjusted returns and to preserve capital in asset market downturns.
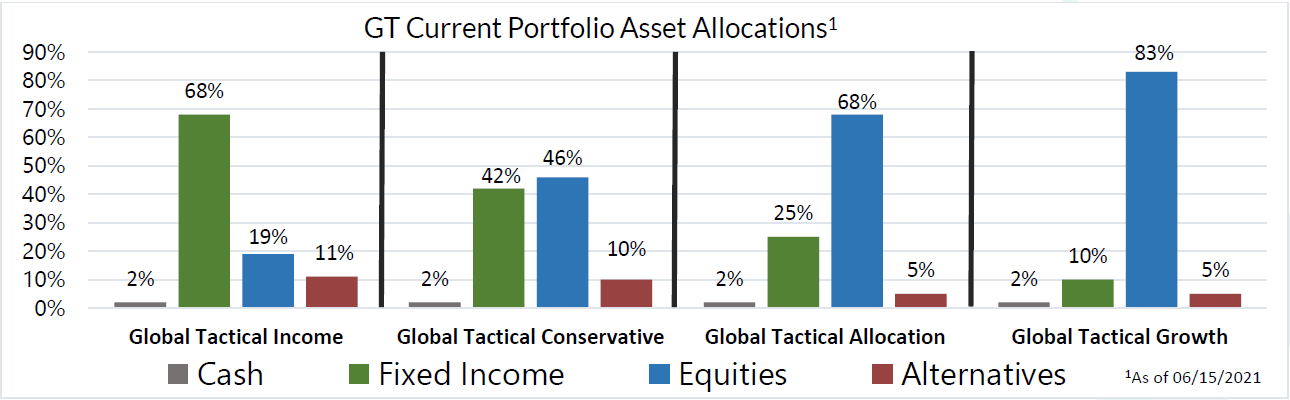
Recent Portfolio Changes
We made no portfolio changes this month.
1 Information as of 06/15/2021. Individual account allocations may differ slightly from model allocations.
You can get more information by calling (800) 642-4276 or by emailing AdvisorRelations@donoghueforlines.com. Also, visit our Sales Team Page to learn more about your territory coverage.
 Best regards,
 John A. Forlines III
Chief Investment Officer
Past performance is no guarantee of future results. The material contained herein as well as any attachments is not an offer or solicitation for the purchase or sale of any financial instrument. It is presented only to provide information on investment strategies, opportunities and, on occasion, summary reviews on various portfolio performances. The investment descriptions and other information contained in this Markets in Motion are based on data calculated by Donoghue Forlines LLC and other sources including Morningstar Direct. This summary does not constitute an offer to sell or a solicitation of an offer to buy any securities and may not be relied upon in connection with any offer or sale of securities.
The views expressed are current as of the date of publication and are subject to change without notice. There can be no assurance that markets, sectors or regions will perform as expected. These views are not intended as investment, legal or tax advice. Investment advice should be customized to individual investors objectives and circumstances. Legal and tax advice should be sought from qualified attorneys and tax advisers as appropriate.
The Donoghue Forlines Global Tactical Allocation Portfolio composite was created July 1, 2009. The Donoghue Forlines Global Tactical Income Portfolio composite was created August 1, 2014. The Donoghue Forlines Global Tactical Growth Portfolio composite was created April 1, 2016. The Donoghue Forlines Global Tactical Conservative Portfolio composite was created January 1, 2018.
Results are based on fully discretionary accounts under management, including those accounts no longer with the firm. Individual portfolio returns are calculated monthly in U.S. dollars. These returns represent investors domiciled primarily in the United States. Past performance is not indicative of future results. Performance reflects the re-investment of dividends and other earnings.
Net returns are presented net of management fees and include the reinvestment of all income. Net of fee performance was calculated using a model fee of 1% representing an applicable wrap fee. The investment management fee schedule for the composite is: Client Assets = All Assets; Annual Fee % = 1.00%. Actual investment advisory fees incurred by clients may vary.
The Donoghue Forlines Global Tactical Allocation Benchmark is the HFRU Hedge Fund Composite. The HFRU Hedge Fund Composite USD Index is designed to be representative of the overall composition of the UCITS-Compliant hedge fund universe. It is comprised of all eligible hedge fund strategies; including, but not limited to equity hedge, event driven, macro, and relative value arbitrage. The Blended Benchmark Conservative is a benchmark comprised of 80% HFRU Hedge Fund Composite and 20% Bloomberg Barclays Global Aggregate, rebalanced monthly. The Blended Benchmark Growth is a benchmark comprised of 80% HFRU Hedge Fund Composite and 20% MSCI ACWI, rebalanced monthly. The Blended Benchmark Income is a benchmark comprised of 60% HFRU Hedge Fund Composite and 40% Bloomberg Barclays Global Aggregate, rebalanced monthly.
The MSCI ACWI Index is a free float adjusted market capitalization weighted index that is designed to measure the equity market performance of developed and emerging markets. The HFRU Hedge Fund Composite USD Index is designed to be representative of the overall composition of the UCITS-Compliant hedge fund universe. It is comprised of all eligible hedge fund strategies; including, but not limited to equity hedge, event driven, macro, and relative value arbitrage. The underlying constituents are equally weighted. The Bloomberg Barclays Global Aggregate Index is a flagship measure of global investment grade debt from twenty-four local currency markets. This multi-currency benchmark includes treasury, government-related, corporate and securitized fixed-rate bonds from both developed and emerging markets issuers.
Index performance results are unmanaged, do not reflect the deduction of transaction and custodial charges or a management fee, the incurrence of which would have the effect of decreasing indicated historical performance results. You cannot invest directly in an Index. Economic factors, market conditions and investment strategies will affect the performance of any portfolio, and there are no assurances that it will match or outperform any particular benchmark.
Policies for valuing portfolios, calculating performance, and preparing compliant presentations are available upon request. For a compliant presentation and/or the firm’s list of composite descriptions, please contact 800‐642‐4276 or info@donoghueforlines.com.
Donoghue Forlines LLC is a registered investment adviser with United States Securities and Exchange Commission in accordance with the Investment Advisers Act of 1940. Registration does not imply a certain level of skill or training.
