“Let be the past; the future guard with greater care.”
-From a Roman Monument, 100 B.C.E.
It’s no secret our global tactical portfolios have been positioned defensively this year. As global macro strategists, we focus on the systemic risk to the global economy and asset markets. Therefore, our instincts are to favor fundamental economic data and protect client’s capital in recessionary environments. This makes us neither “perma-bulls” nor “perma-bears” but process focused investors who alter our positioning as the facts change and identify positions where asymmetric risk reward exists. In a recession, anything can happen of course, but the longer this one lingers, it’s still wise to have a core part of your clients’ portfolios in tactical strategies that can be defensive in uncertain times.
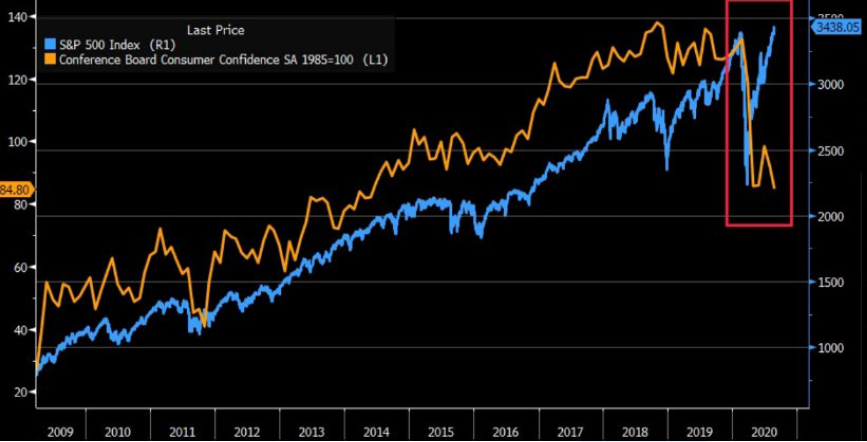
This is not your normal recession: A pandemic, the resulting sharpest growth downturn in modern times and soaring government debt all occurring in a normally volatile US Presidential election year make this one for the books. Meanwhile, the fastest equity bear market in history was followed by the quickest recovery to new highs. Growth has rebounded (albeit unevenly) as economic lockdowns have ended, but most forecasts (including our own) suggest the level of activity will not return to its pre-crisis levels before the end of next year. The only valuation metric the market looks attractive is comparing earnings yields with the returns on available cash and bonds. This is the so-called TINA (there is no alternative) argument. The sharp decline in interest rates certainly supports higher equity valuations, but it also reflects a very bleak long-run outlook for economic growth and thus earnings and stock prices. But a bull market that depends largely on simulative policy is problematic… therefore, we clearly see a disconnect between future economic prospects and risky asset prices. (See Chart 1)
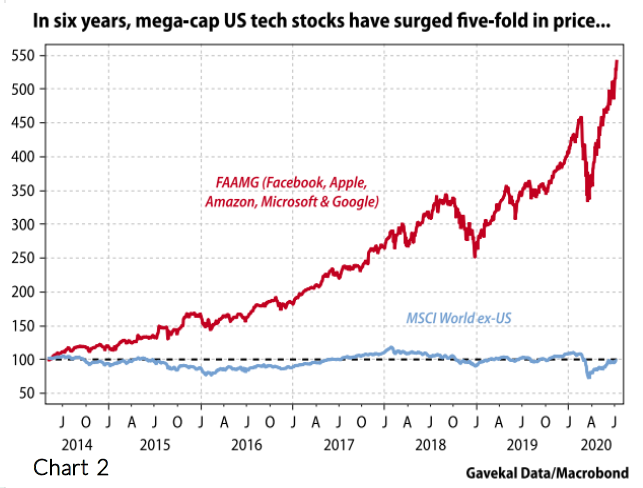
History tells us that the fundamental performance of companies cannot sustainably diverge from that of the underlying economy—see the “Tech Wreck” of 2000-2002 as the most recent example. How bad was it? Tech-centric funds had up to 90% peak-to-trough drawdowns and Nasdaq-centric funds fell from 60%-75%. In the short term, share prices can reflect large swings in valuations driven by investor sentiment. This irrational exuberance has been concentrated squarely in “big tech”. The top 5 companies in the world by market cap (Facebook, Apple, Amazon, Microsoft, Google) have risen five-fold over the past six years, while over the same period the MSCI World ex-US index has flat-lined. In fact, with the median stock price still down on the year, manager performance can largely be explained by their exposure to these stocks. (See Chart 2)
How Should You Use Our GT Suite of Products: As we have long believed, our Portfolios and Funds work best when combined with riskier 80-100% equity indexes and models; indeed, if the bull case rests simply on the TINA argument, then it implies the current high valuations could persist over the medium term and Advisors and Clients will benefit from continued equity upside, but also have “insurance” against a reversion to fundamentals. We continue to invest according to our Post-COVID Virus Playbook, which has led us to equity sectors and factors like biotechnology and high cash flow companies that have been winners in the Virus Market. As we note above: tactical and unconstrained management is now more important than ever. And, if history is a guide, eventually fundamentals will matter again.
Fast forward to today, gravity has taken affect and opportunities are starting to present themselves. The Nasdaq 100 is 10% off previous highs, wiping out the august melt up rally. While the trade is still crowded and may take longer to unwind, we can see long term buying opportunities. There are also opportunities emerging in “under owned” and “unloved” pockets of the market looking to mean revert. Throughout the crisis, we have discussed the emergence of clear winners and clear losers. It will be important to dissect the “market of stocks” rather than just considering the “stock market” and choosing the right regions, sectors and factor exposure will be crucial. We will continue to monitor financial conditions and stand ready if our risk management process warrants action.
With this month’s moves, we trimmed weak dollar positions in emerging markets and gold. The dollar has formed a short-term bottom and will be a headwind to these asset classes. Additionally, we are taking advantage of a price decline and initiating a position in broad growth equities.
Finally, know that all our Strategies will adapt to fundamental or rules – based, not emotional influences. We seek opportunities for solid risk adjusted returns and to preserve capital in asset market downturns.
Recent Portfolio Changes
We trimmed positions in emerging markets and gold. The dollar has formed a short-term bottom and will be a headwind for both asset classes over a tactical timeframe.
We initiated a position in Large Cap Growth equities. Growth stocks will continue to outperform in an environment of weak economic growth and lower-for-longer interest rates. After an overdue correction, we identified an attractive entry point.
Please do not hesitate to contact our team with any questions. You can get more information by calling (800) 642-4276 or by emailing AdvisorRelations@donoghue.com. Also, visit our Contact Page to learn more about your territory coverage.
Best regards,
John A. Forlines, III
2 Contains international exposure.
Past performance is no guarantee of future results. The material contained herein as well as any attachments is not an offer or solicitation for the purchase or sale of any financial instrument. It is presented only to provide information on investment strategies, opportunities and, on occasion, summary reviews on various portfolio performances. The investment descriptions and other information contained in this Markets in Motion are based on data calculated by W.E. Donoghue & Co., LLC (W.E. Donoghue) and other sources including Morningstar Direct. This summary does not constitute an offer to sell or a solicitation of an offer to buy any securities and may not be relied upon in connection with any offer or sale of securities.
The views expressed are current as of the date of publication and are subject to change without notice. There can be no assurance that markets, sectors or regions will perform as expected. These views are not intended as investment, legal or tax advice. Investment advice should be customized to individual investors objectives and circumstances. Legal and tax advice should be sought from qualified attorneys and tax advisers as appropriate.
The JAForlines Global Tactical Allocation Portfolio composite was created July 1, 2009. The JAForlines Global Tactical Income Portfolio composite was created August 1, 2014. The JAForlines Global Tactical Growth Portfolio composite was created April 1, 2016. The JAForlines Global Tactical Conservative Portfolio composite was created January 1, 2018.
Results are based on fully discretionary accounts under management, including those accounts no longer with the firm. Individual portfolio returns are calculated monthly in U.S. dollars. Policies for valuing portfolios and calculating performance are available upon request. These returns represent investors domiciled primarily in the United States. Past performance is not indicative of future results. Performance reflects to re-investment of dividends and other earnings.
Net returns are presented net of management fees and include the reinvestment of all income. Net of fee performance was calculated using a model fee of 1% representing an applicable wrap fee. The investment management fee schedule for the composite is: Client Assets = All Assets; Annual Fee % = 1.00%. Actual investment advisory fees incurred by clients may vary.
W.E. Donoghue & Co., LLC (Donoghue) claims compliance with the Global Investment Performance Standards (GIPS®).
The Blended Benchmark Conservative is a benchmark comprised of 80% HFRU Hedge Fund Composite and 20% Bloomberg Barclays Global Aggregate, rebalanced monthly.
The Blended Benchmark Growth is a benchmark comprised of 80% HFRU Hedge Fund Composite and 20% MSCI ACWI, rebalanced monthly.
The Blended Benchmark Income is a benchmark comprised of 60% HFRU Hedge Fund Composite and 40% Bloomberg Barclays Global Aggregate, rebalanced monthly.
The MSCI ACWI Index is a free float adjusted market capitalization weighted index that is designed to measure the equity market performance of developed and emerging markets. The HFRU Hedge Fund Composite USD Index is designed to be representative of the overall composition of the UCITS-Compliant hedge fund universe. It is comprised of all eligible hedge fund strategies; including, but not limited to equity hedge, event driven, macro, and relative value arbitrage. The underlying constituents are equally weighted. The Bloomberg Barclays Global Aggregate Index is a flagship measure of global investment grade debt from twenty-four local currency markets. This multi-currency benchmark includes treasury, government-related, corporate and securitized fixed-rate bonds from both developed and emerging markets issuers.
Index performance results are unmanaged, do not reflect the deduction of transaction and custodial charges or a management fee, the incurrence of which would have the effect of decreasing indicated historical performance results. You cannot invest directly in an Index. Economic factors, market conditions and investment strategies will affect the performance of any portfolio, and there are no assurances that it will match or outperform any particular benchmark.
Policies for valuing portfolios, calculating performance, and preparing compliant presentations are available upon request. For a compliant presentation and/or the firm’s list of composite descriptions, please contact 800‐642‐4276 or info@donoghue.com.
W.E. Donoghue is a registered investment adviser with United States Securities and Exchange Commission in accordance with the Investment Advisers Act of 1940.


