

2024 is starting to produce volatility and we wanted to share our quarterly Market Commentary that incorporates all of our SMA product offerings (fundamental, rules-based, & blended strategies). This brings our entire investment ecosystem under one commentary and provides easier access to information for our clients. We will continue to publish monthly Markets in Motion pieces to discuss market conditions as they evolve and will provide trade updates for all strategies. We are committed to providing risk managed and transparent solutions to all our clients. Typically risk markets go through periods of quiet bull runs and steep bear drawdowns. To prepare, we believe it is important to incorporate tactical solutions as part of an overall allocation.
Market Reversals
In our last Markets in Motion, we believed the consensus soft landing narrative was wrong, that there are elevated odds of a mild global recession in the next 12 months, and that it will eventually weigh on the price of risk assets. While the market continued to run higher for a little while, markets have seen large reversals in the past few weeks.
None more important than the implosion of the AI hype which has powered mega cap valuations and the entire bull market the last couple years. NVDA is more than 20% off its high, while MSFT, GOOGL, and AAPL drawdowns are not far behind.
A couple of quarters ago, tech companies were falling over themselves to tell investors how AI would soon boost sales and earnings into the stratosphere. Fast forward to today, and many of the same companies are telling investors that the AI pay-off will take more time than initially expected. Of course, the writing had been on the wall for a while. The current earnings season highlights how, despite the tens of billions invested in AI, tech behemoths and multinationals have yet to deliver a meaningful acceleration in earnings.
Against this backdrop we got two announcements that may further shake the market’s disbelief. Berkshire Hathaway announced that despite a record cash pile, it had slashed its holdings of Apple shares by half and Intel announced it will shed 15,000 workers, 20% of its workforce.
We believe once things begin to turn,the negative feedback loops will persist and financial conditons will become less favorable. We have seen catalysts take shape in past few weeks and that we believe is shedding light on the changing macroecnomic conditons.
The Economy is Starting to Freeze
Just as water can abruptly turn into ice if the temperature falls far enough, the economy can also freeze quickly when catalysts materialize.
The analogy to freezing water helps explain why recessions often start seemingly out of the blue. As evidenced on table 1, GDP growth at the business cycle peak is positive. The Financial Crisis began in December 2007. In the fourth quarter of that year, real GDP expanded by 2.5%. Through 2006 and 2007, home prices declined while pockets of stress surfaced in some corners of the financial system such as subprime mortgage lending. As 2008 rolled on, the weakening economy put further strain on banks. Ailing banks cut back on lending, leading to an even weaker economy, and more nonperforming loans. A violent cycle erupted, culminating in the Global Financial Crisis. (Chart 1)
Recessions Often Start Quickly
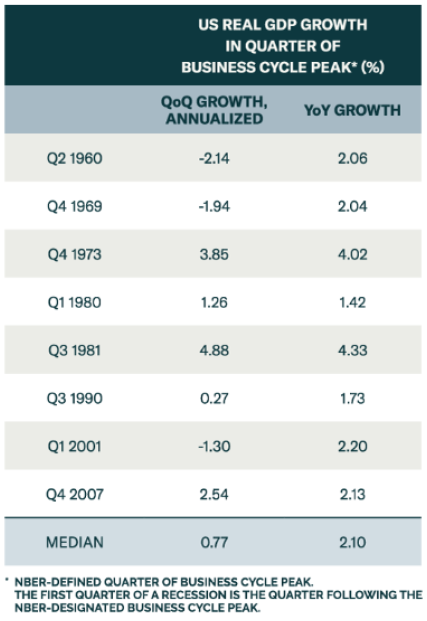
(Chart 1) Source: BCA Research
While we do not expect anything as large as that this time around, we do believe similar feedback loops will weaken the economy. In our last commentary, we discussed our view on the labor market, and we believe it can weaken abruptly. We believe this will cause consumers to raise precautionary savings. The low-end consumer is now feeling the squeeze of higher living costs, higher interest rates, higher local taxes and insurance payments, while wages are no longer rising so fast.
It is important to note that the economy is still digesting the fastest rate hiking cycle in four decades. Which begs the question, can the Fed save the economy by cutting? We do not think so.
The Fed Likely Won’t Stop the Coming Recession
In the absence of overwhelming evidence that the economy is at imminent risk of a recession, fear of a second wave of inflation will make the Fed reluctant to cut rates aggressively. Another overshoot could unanchor long term inflation expectations.
Historically, it is a good time to sell risk assets when the Fed initially cuts rates. We believe the market will have to suffer significantly before the Fed is forced to take the necessary steps to loosen financial conditions.
Financial stability breeds instability. Stability encourages more leverage, which plants the seeds of potential squeezes and brutal collapses. We believe there are elevated odds of a mild global recession in the next 12 months, and that it is starting to weigh on the price of risk assets.
We believe starting points matter. Valuations of mega cap stocks and AI darlings have continued to build up even as cracks in the surface began to form. Semiconductors, which are essential to the implementation to AI the same way picks and shovels were to the gold rush. They are trading at extremely elevated valuations only seen in the 2000 technology bubble. Even a valuation reset back to the average of the last decade could move markets much lower.
We believe that tactical asset allocation will be critical to clients meeting their long-term objectives. Therefore, we continue to stress the importance of tactical management. In today’s environment, advisors are challenged to rethink foundational elements of investor portfolios – which means seeking out strategies that bolster the “core” going forward. We will continue to provide solutions for the next generation of investing. (Chart 2)
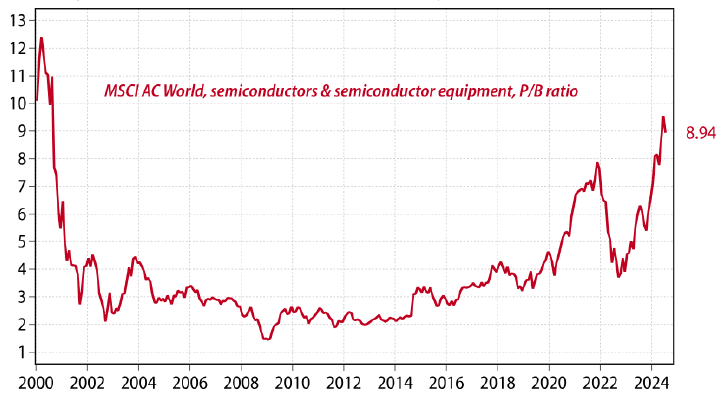
(Chart 2) Source: Gavekal Research/Macrobond
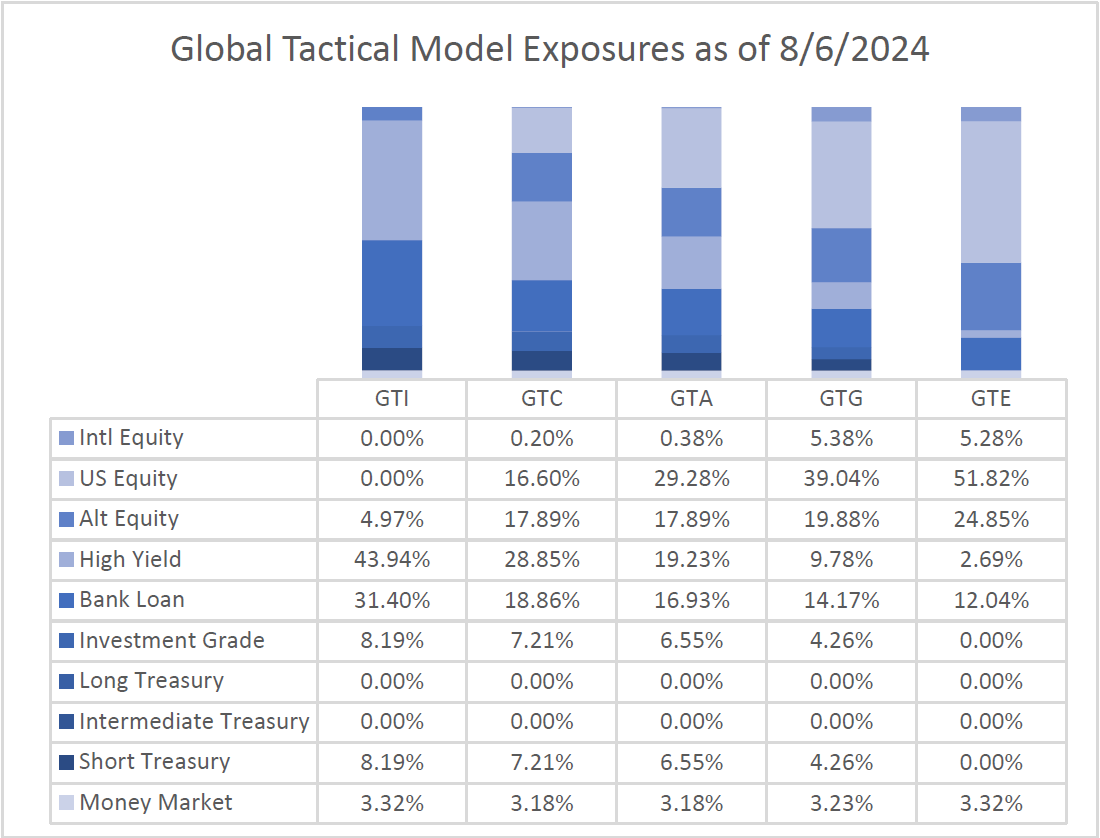
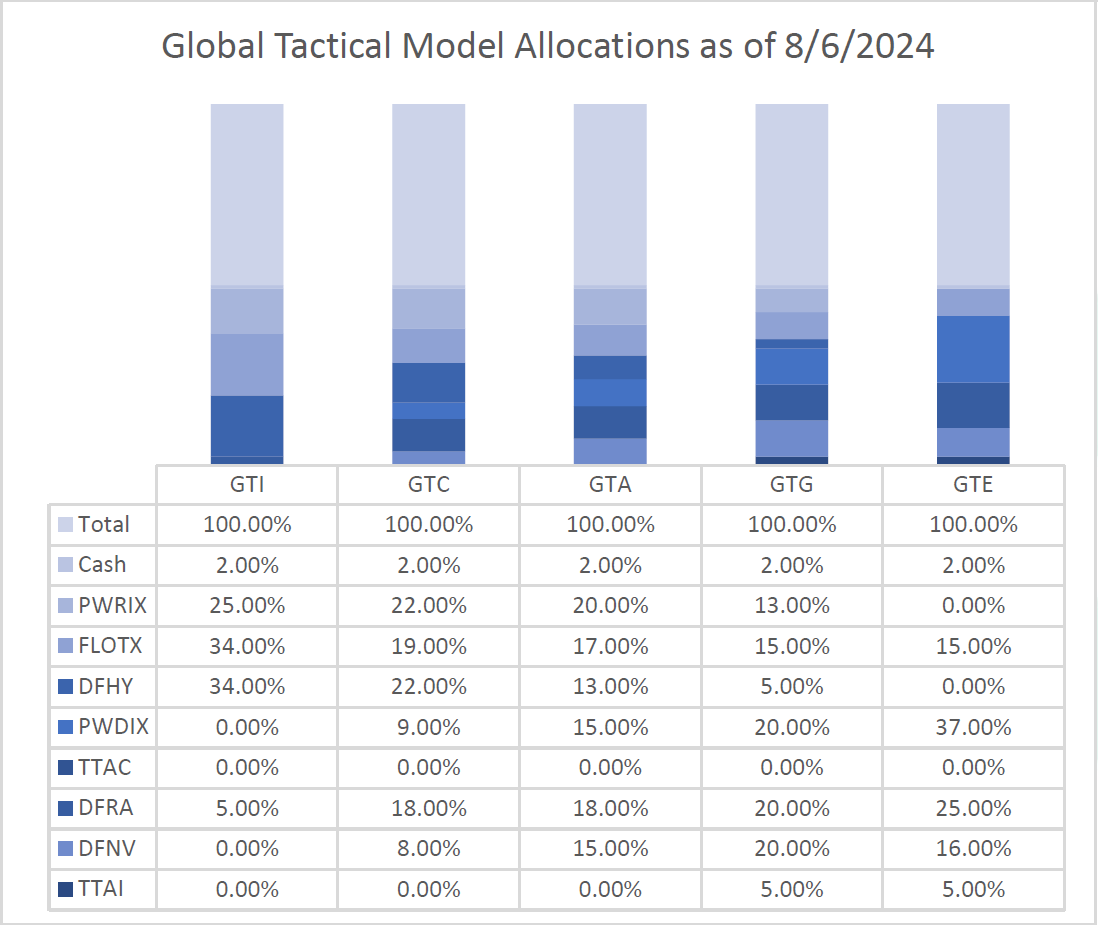
Fundamental Portfolios
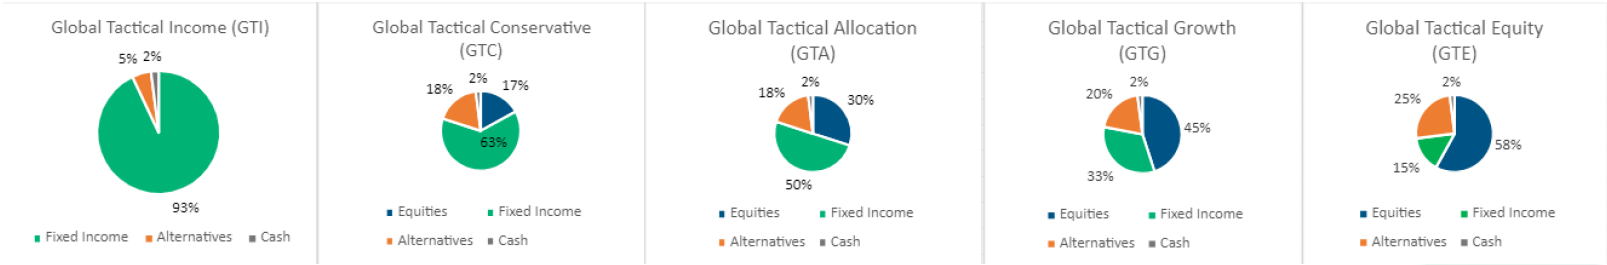
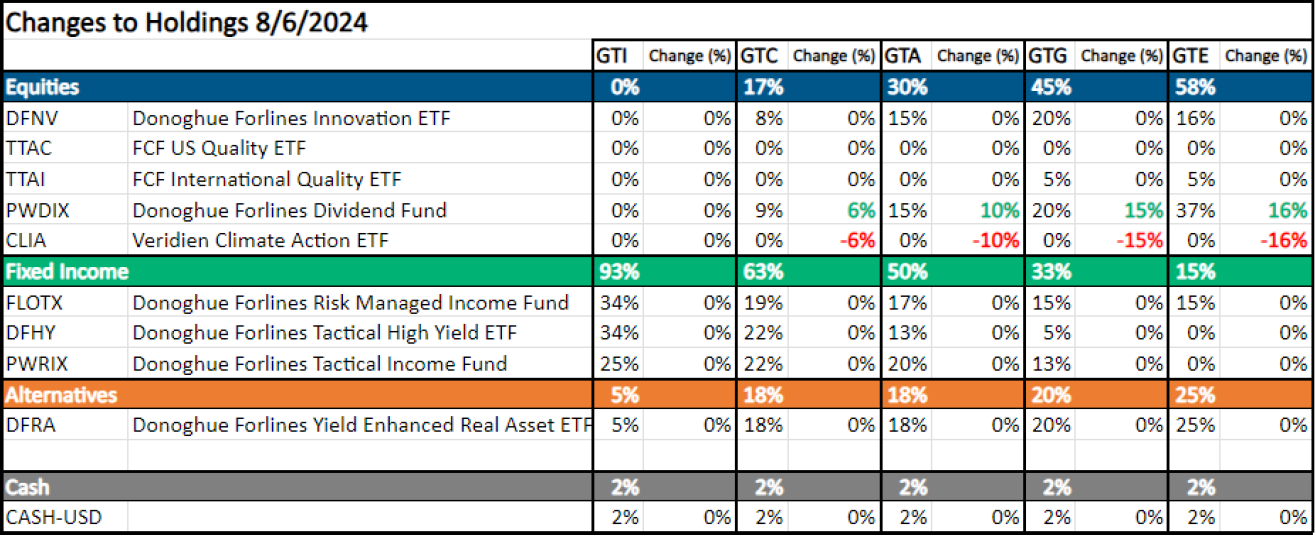
As we enter the second half of 2024, our portfolios are positioned underweight to risk. At the beginning of April, we removed overweight positions in equity, and are prepared to move positioning even more defensively as the year evolves. This will include larger allocations to tactical fixed income investments across the term premium.
Recently in the third quarter, we transferred equity exposure into value-oriented areas of the market, specifically dividend stocks. We exited our climate position, while we believe the asset class has long term viability, there will be extended volatility around the election cycle and higher valuations.
We will adapt as the facts change and focus on catalysts for investment regime change.
(Positioning as of 8/6/2024)
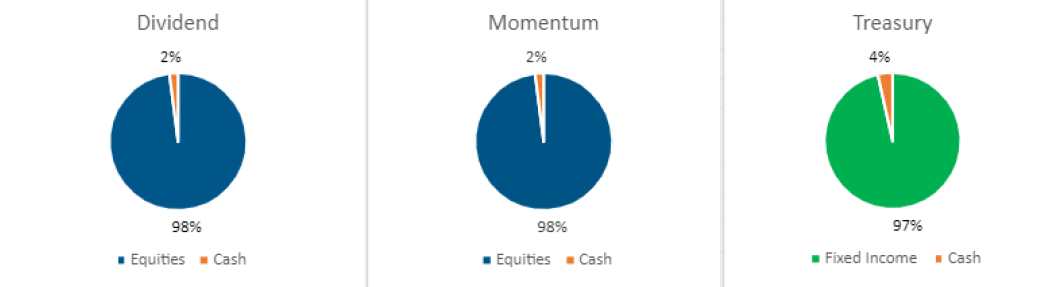
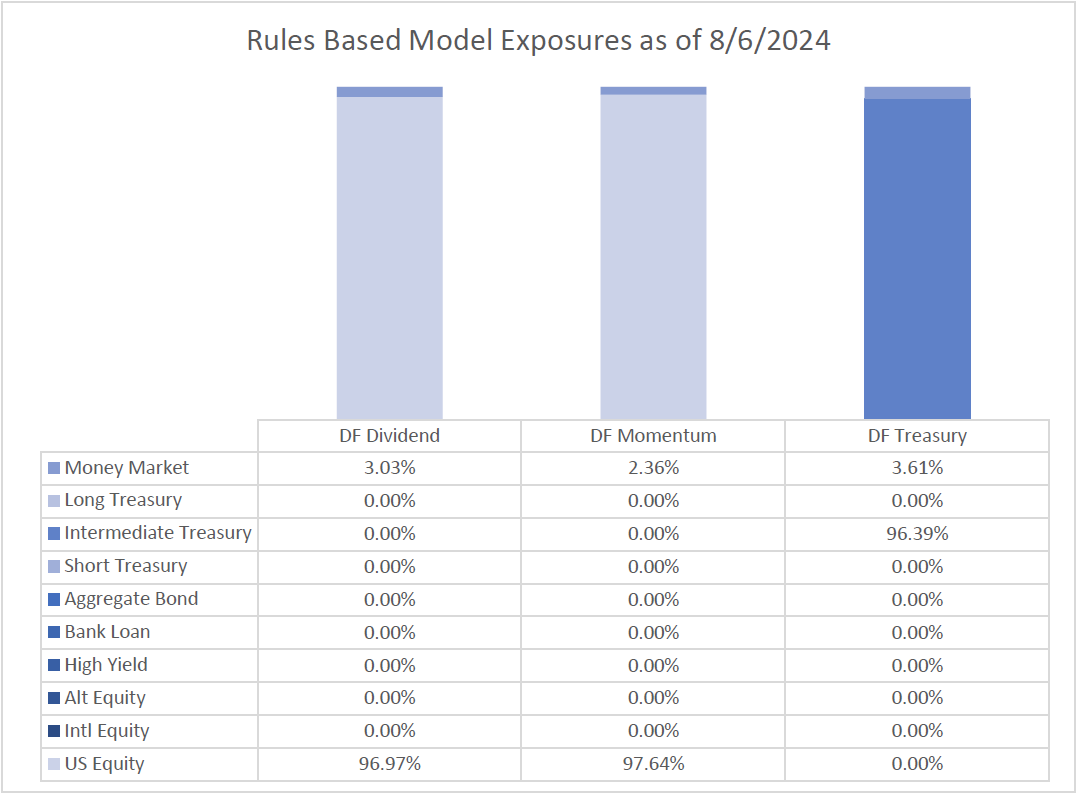
Rules Based Portfolios
The technical picture for equities remains positive with long-term trends remaining intact.
Our Momentum strategy remained fully invested in equities throughout the quarter and was able to take advantage of the risk-on environment. The strategy’s performance ranked in the top 1% in its category YTD, and in the top 3% of its category for 1-year trailing performance. The technical picture for growth stocks, while waning, remains in an uptrend and would likely need to see quick price deterioration to trigger a more defensive posture.
Our Dividend strategy remained fully invested in equities throughout the quarter and was able to take advantage of the risk-on environment. The technical picture for value equities remains in an uptrend but is weaker than stocks broadly. If markets were to turn, we could see the Dividend strategy move to a defensive posture more quickly. We believe dividend stocks are poised to outperform broader equities for the remainder of 2024.
Our Treasury strategy remained in shorter duration instruments for the entirety of the quarter. Rate volatility is still large and we have avoided long duration bonds. We expect to allocate to longer duration bonds more frequently for the remainder of 2024.
(Positioning as of 8/6/2024)
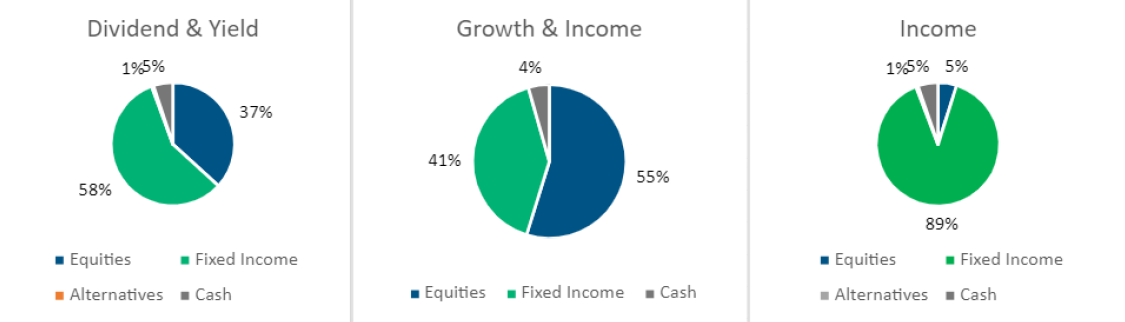
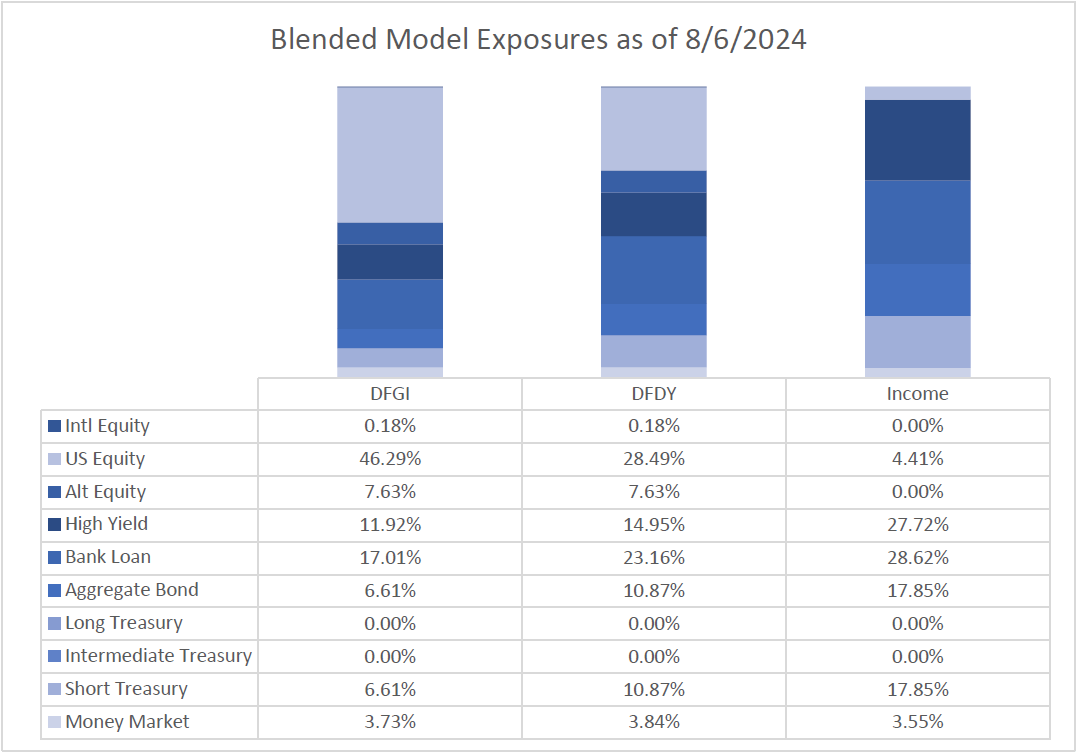
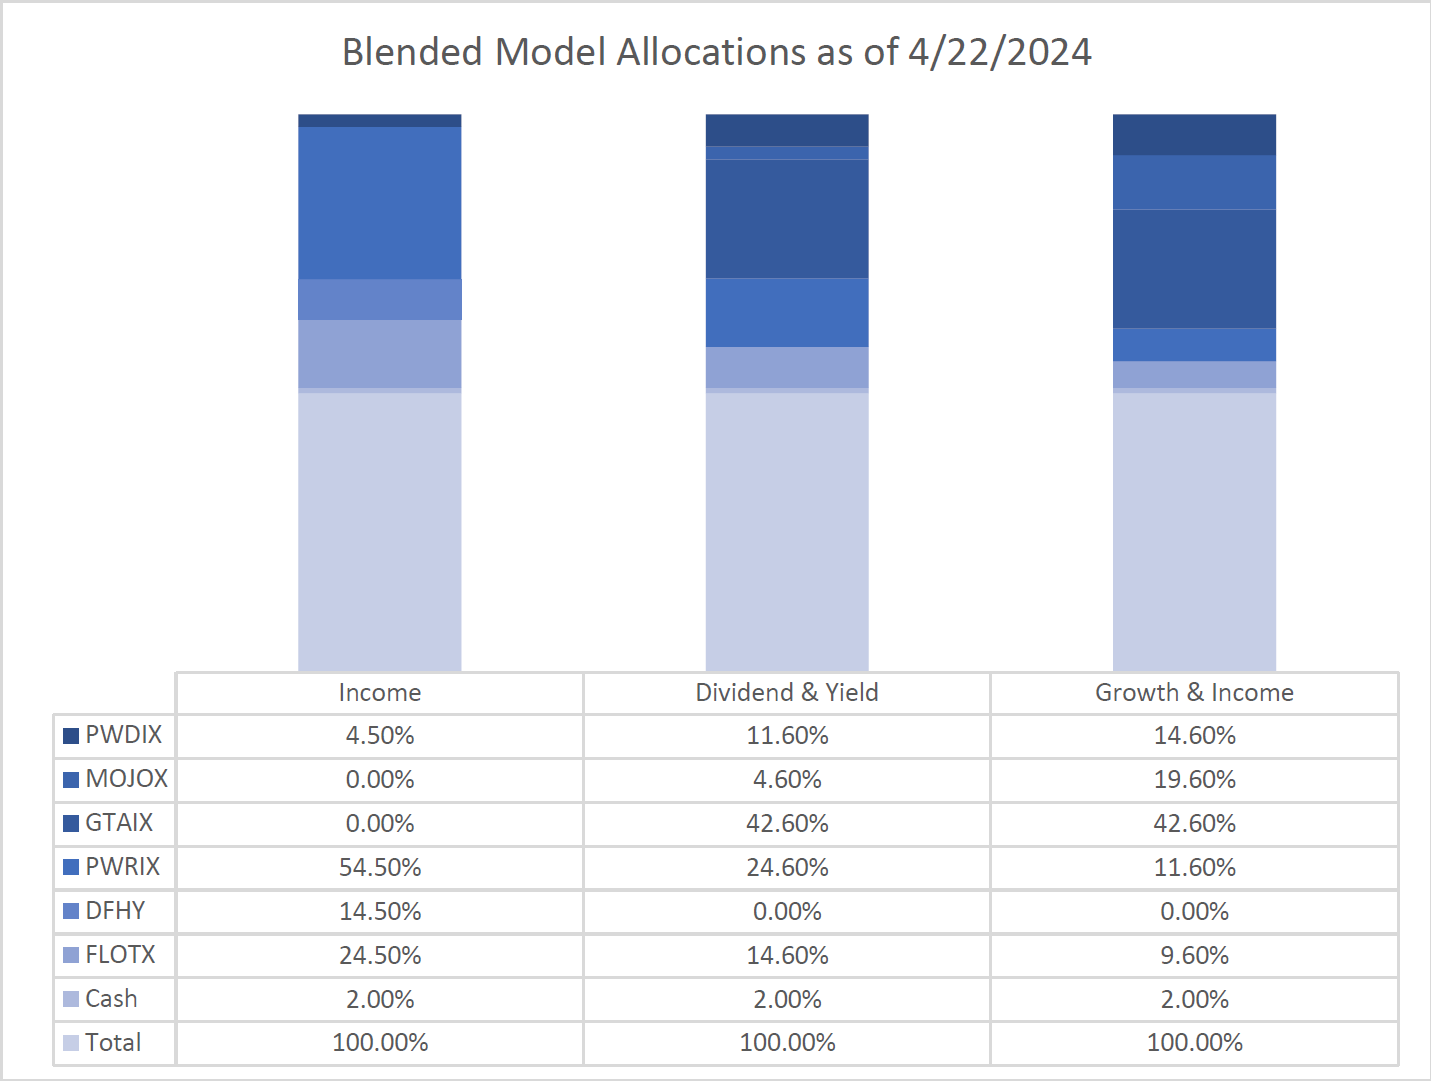
Blended Portfolios
The blended portfolios are a proprietary mix of our fundamental macro portfolios and our rules-based quantitative portfolios.
Through this combination, we were able to take advantage of the sanguine risk environment in the second quarter of 2024. Our top-down asset allocation mirrored our fundamental outlook and overweighted our tactical allocation and tactical income funds in the strategies, where we are now underweight risk in equities & credit. Our momentum fund was a powerful driver of performance.
Heading into the rest of 2024 our top-down asset allocation mirrors our fundamental outlook – positioned underweight to risk. Our equity rules-based strategies are currently fully invested, and our risk managed income fund is positioned in high yield bonds and floating rate securities. We recently decreased allocations to our equity funds, selling out of our momentum fund, and increased allocations to tactical fixed income funds.
We will adapt as the facts change and focus on catalysts for investment regime change.
(Positioning as of 8/6/2024)
You can get more information by calling (800) 642-4276 or by emailing AdvisorRelations@donoghueforlines.com.
 Best regards,
John A. Forlines III
Chief Investment Officer
IMPORTANT RISK INFORMATION
Past performance is no guarantee of future results. Performance prior to January 1, 2018 was earned on accounts managed at a predecessor firm, JAForlines Global. The person primarily responsible for achieving that performance continues to manage accounts at Donoghue Forlines in a substantially similar manner. The material contained herein as well as any attachments is not an offer or solicitation for the purchase or sale of any financial instrument. It is presented only to provide information on investment strategies, opportunities and, on occasion, summary reviews on various portfolio performances. The investment descriptions and other information contained in this Markets in Motion are based on data calculated by Donoghue Forlines LLC and other sources including Morningstar Direct. This summary does not constitute an offer to sell or a solicitation of an offer to buy any securities and may not be relied upon in connection with any offer or sale of securities. The views expressed are current as of the date of publication and are subject to change without notice. There can be no assurance that markets, sectors or regions will perform as expected. These views are not intended as investment, legal or tax advice. Investment advice should be customized to individual investors objectives and circumstances. Legal and tax advice should be sought from qualified attorneys and tax advisers as appropriate. The calculation and presentation of performance has not been approved or reviewed by the SEC or its staff.
The Donoghue Forlines Global Tactical Allocation Portfolio composite was created July 1, 2009. The Donoghue Forlines Global Tactical Income Portfolio composite was created August 1, 2014. The Donoghue Forlines Global Tactical Growth Portfolio composite was created April 1, 2016. The Donoghue Forlines Global Tactical Conservative Portfolio composite was created January 1, 2018. The Donoghue Forlines Global Tactical Equity Portfolio composite was created January 1, 2018. The Donoghue Forlines Dividend Portfolio Composite was created on January 1, 2013. The Donoghue Forlines Treasury Portfolio was created on August 1, 2017. The Donoghue Forlines Momentum Portfolio Composite was created March 1, 2016. The Donoghue Forlines Dividend & Yield Portfolio Composite was created December 1, 2011. The Donoghue Forlines Growth & Income Portfolio Composite was created January 1, 2015. The Donoghue Forlines Income Portfolio Composite was created June 1, 2008.
Results are based on fully discretionary accounts under management, including those accounts no longer with the firm. Individual portfolio returns are calculated monthly in U.S. dollars. These returns represent investors domiciled primarily in the United States. Past performance is not indicative of future results. Performance reflects the re-investment of dividends and other earnings.
Net 3% Returns
For all portfolios, net 3% returns are presented net of a hypothetical maximum fee of three percent (3%). Actual fees applicable to an individual investor’s account will wary and no individual investor may incur a fee as high as 3%. Please consult your financial advisor for fees applicable to your account. Individual returns will vary.
Fee Schedule
The investment management fee schedule for all portfolios is: Client Assets = All Assets; Annual Fee % = 0.00%. Actual investment advisory fees incurred may vary and should be confirmed with your financial advisor.
Each portfolio includes holdings on which Donoghue Forlines may receive management fees as the advisor and/or subadvisor or from separate revenue sharing agreements. Please see the prospectuses for additional disclosures.
The investment management fee schedule for the composites is: Client Assets = All Assets; Annual Fee % = 0.00%. Actual investment advisory fees incurred may vary and should be confirmed with your financial advisor.
The Donoghue Forlines Global Tactical Allocation Benchmark is the HFRU Hedge Fund Composite. The Blended Benchmark Conservative is a benchmark comprised of 80% HFRU Hedge Fund Composite and 20% Bloomberg Global Aggregate, rebalanced monthly. The Blended Benchmark Growth is a benchmark comprised of 80% HFRU Hedge Fund Composite and 20% MSCI ACWI, rebalanced monthly. The Blended Benchmark Income is a benchmark comprised of 60% HFRU Hedge Fund Composite and 40% Bloomberg Global Aggregate, rebalanced monthly. The Blended Benchmark Equity is a benchmark comprised of 60% HFRU Hedge Fund Composite and 40% MSCI ACWI.
The MSCI ACWI Index is a free float adjusted market capitalization weighted index that is designed to measure the equity market performance of developed and emerging markets. The HFRU Hedge Fund Composite USD Index is designed to be representative of the overall composition of the UCITS-Compliant hedge fund universe. It is comprised of all eligible hedge fund strategies; including, but not limited to equity hedge, event driven, macro, and relative value arbitrage. The underlying constituents are equally weighted. The Bloomberg Global Aggregate Index is a flagship measure of global investment grade debt from twenty-four local currency markets. This multi-currency benchmark includes treasury, government-related, corporate and securitized fixed-rate bonds from both developed and emerging markets issuers. The DJ Moderately Conservative index measures the performance of returns on its total portfolios with a target risk level of Moderately Conservative-investor will take 40% of all stock portfolio risk. Its portfolios include three major asset classes: stocks, bonds and cash. The weightings are rebalanced monthly to maintain the target level. The index is subset of the global series of Dow Jones Relative Risk Indices. The DJ Conservative index measures the performance of returns on its total portfolios with a target risk level of Conservative-investor will take 20% of all stock portfolio risk. Its portfolios include three major asset classes: stocks, bonds and cash. The weightings are rebalanced monthly to maintain the target level. The index is subset of the global series of Dow Jones Relative Risk Indices. The DJ Moderate index measures the performance of returns on its total portfolios with a target risk level of Moderate investor will to take 60% of all stock portfolio risk. Its portfolios include three major asset classes: stocks, bonds and cash. The weightings are rebalanced monthly to maintain the target level. The index is subset of the global series of Dow Jones Relative Risk Indices. The Russell 1000 Value Index is for comparison purposes only. The index is a market-capitalization weighted index of those firms in the Russell 1000 with lower price-to- book ratios and lower forecasted growth values. The Russell 1000 includes the largest 1000 firms in the Russell 3000, which represents approximately 98% of the investable U.S. equity market. The Russell 1000 Index is for comparison purposes only. The index consists of the 1000 largest companies within the Russell 3000 index. Also known as the Market-Oriented Index, because it represents the group of stocks from which most active money managers choose. The returns for the index are total returns, which include reinvestment of dividends. Frank Russell Company reports its indices as one-month total returns. The Bloomberg US Long Treasury Index, Bloomberg US Intermediate Treasury Index, are for comparison purposes only. Bloomberg US Long Term Treasury Index measures the performance of US treasury bonds with long term maturity. The credit level for this index is investment grade. Bloomberg US Intermediate Term Treasury Index measures the performance of US treasury notes with intermediate term maturity. The credit level for this index is investment grade.
Index performance results are unmanaged, do not reflect the deduction of transaction and custodial charges or a management fee, the incurrence of which would have the effect of decreasing indicated historical performance results. You cannot invest directly in an Index. Economic factors, market conditions and investment strategies will affect the performance of any portfolio, and there are no assurances that it will match or outperform any particular benchmark.
Policies for valuing portfolios, calculating performance, and preparing compliant presentations are available upon request. For a compliant presentation and/or the firm’s list of composite descriptions, please contact 800‐642‐4276 or info@donoghueforlines.com.
Donoghue Forlines LLC is a registered investment adviser with the United States Securities and Exchange Commission in accordance with the Investment Advisers Act of 1940. Registration does not imply a certain level of skill or training.

