The market came into the 2nd quarter of 2026 with weakness due to concerns over Trump’s launch of operation Epic Fury alongside Israel against Iran. In the month of April, global markets experienced a turnaround resulting in a double digit return in most of the global equity indices for the 2nd quarter largely as a result of improving global geopolitical tensions. As depicted in the following chart, the S&P 500 Index was up over 15% for the quarter and up about 10% year to date. The sector that continues to show the most strength was technology, which was up over 31% for the quarter. This was largely attributable to sub-industries such as hardware and semiconductors. On the flip side, the weakest sector for the quarter was energy, largely due to oil prices coming back down as tensions eased.
S&P 500 Index Returns and Valuation by Sector
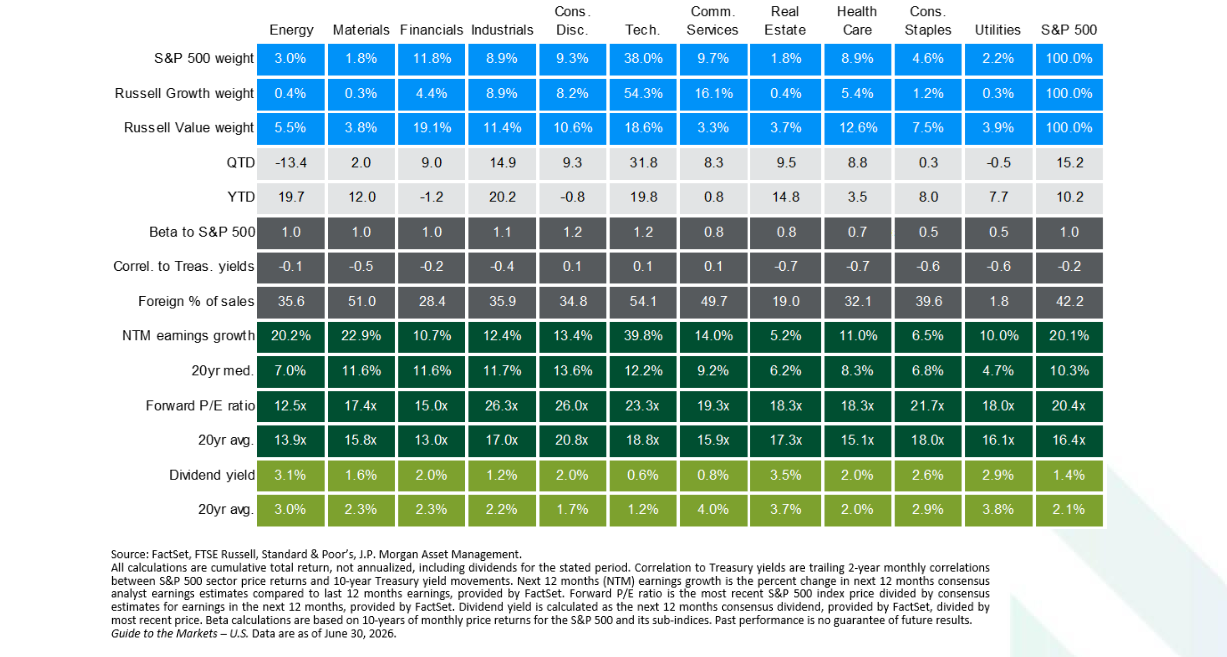
The market strength continues to be driven by a strong fundamental earnings growth backdrop. As is evidenced in the preceding chart, forward 12-month earnings growth expectations for the S&P 500 index are at 20%. This is about double the prior 20-year median average. The technology sector again is the leading driver with forward expectations up about 39%. However, all 11 sectors have forward growth expectations for earnings over the coming 12 months. It should be understood that this growth comes at a price and by most market valuation metrics such as historical price to earnings multiples valuations are elevated.
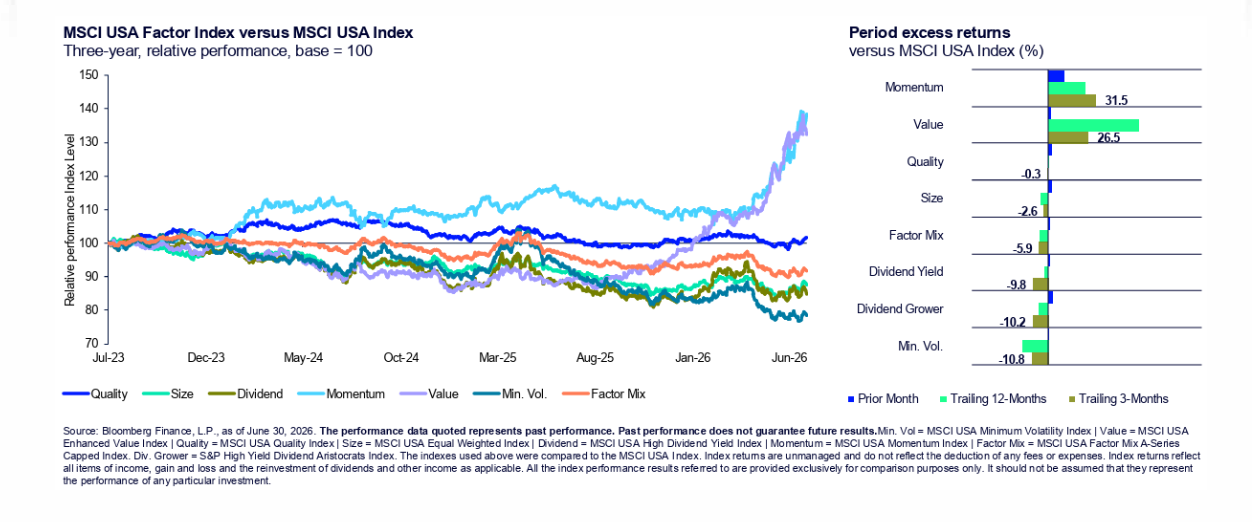
Momentum and Value Offer Positive Excess Return during Q2
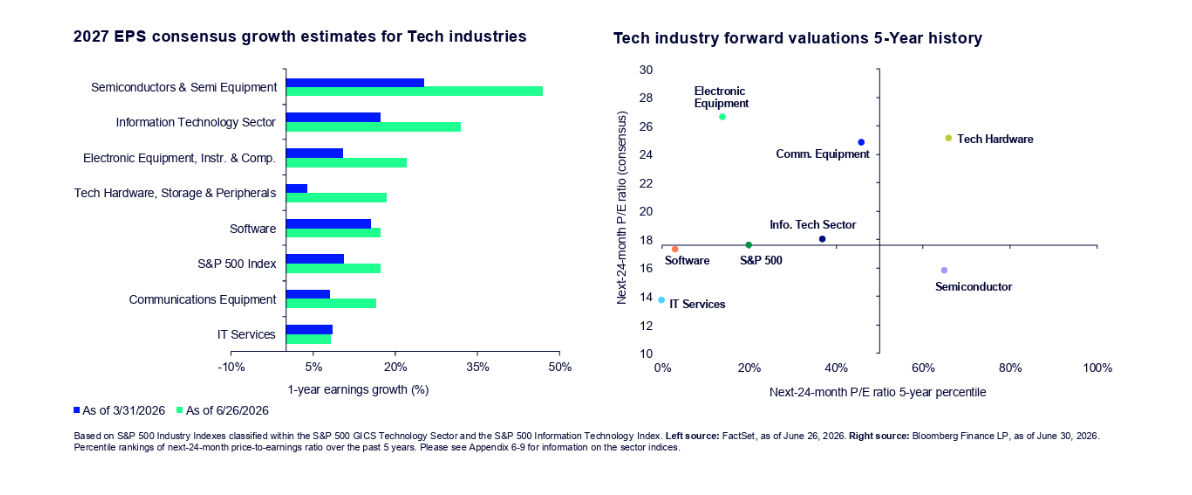
Tech Maintains Strong Earnings Visibility into 2027
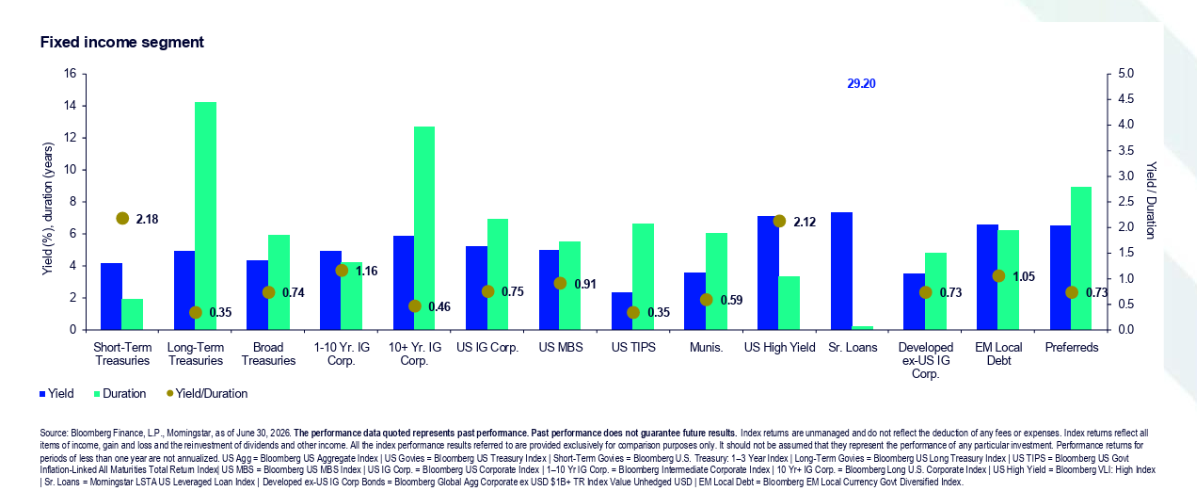
The Shorter End of the Curve Offers a More Compelling Yield Profile
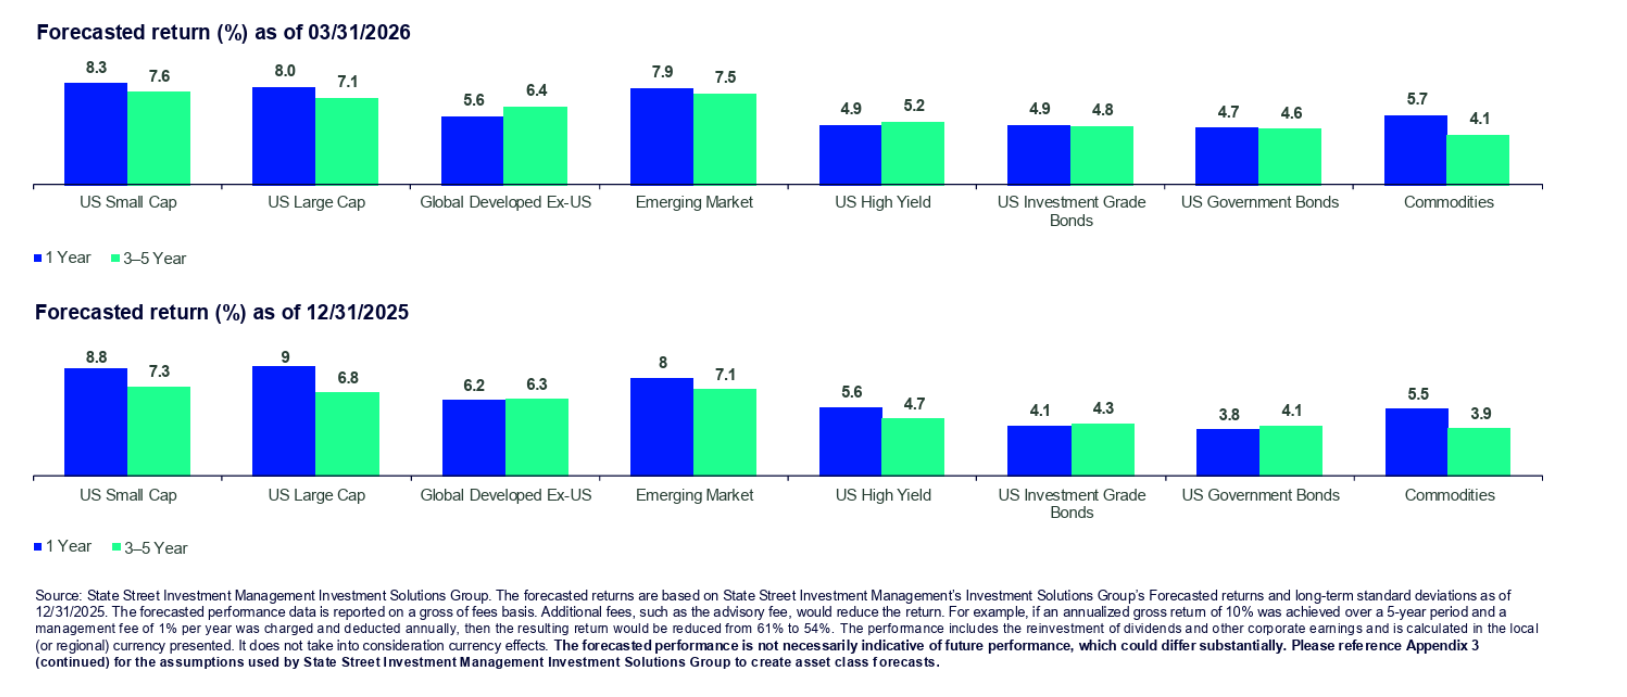
Asset Class Forecast
The markets are elevated as expectations for growth in the nearer term are strong. However, economic cycles eventually do run their course and can change. It is difficult to predict turning points and higher valuations aren’t a good timing indicator in the short term. Over time valuations tend to mean revert and recessive conditions are part of cycles. Although the market will continue to experience volatility with elevated prices, we continue to believe the trend is our friend and will continue to invest accordingly.
Fundamental Portfolios
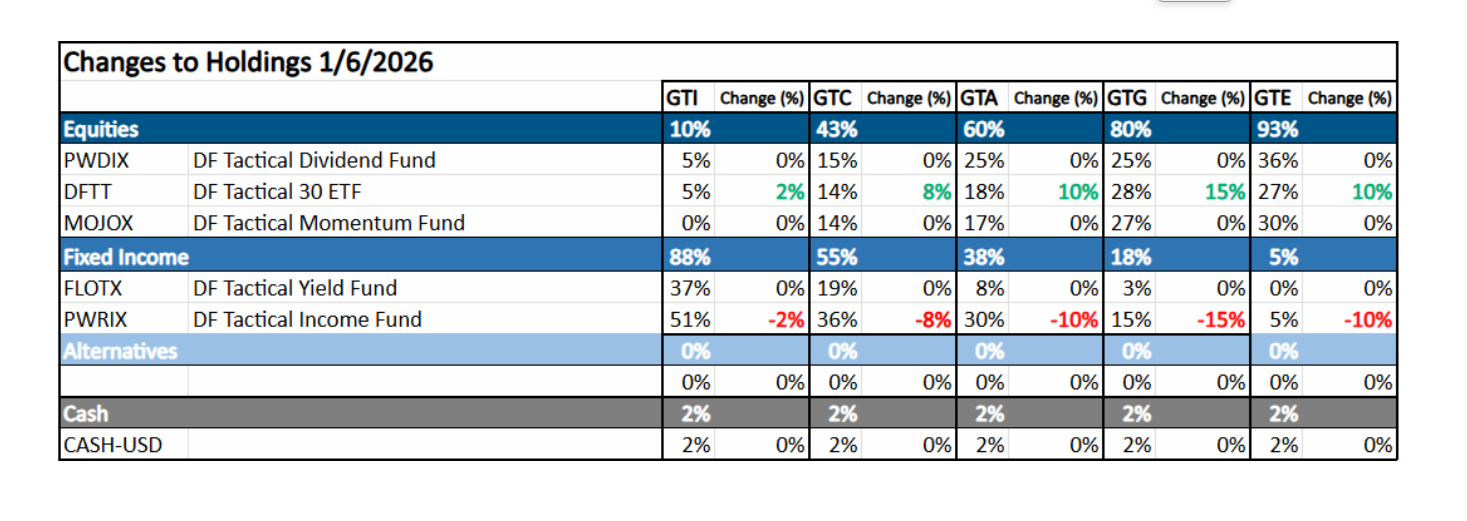
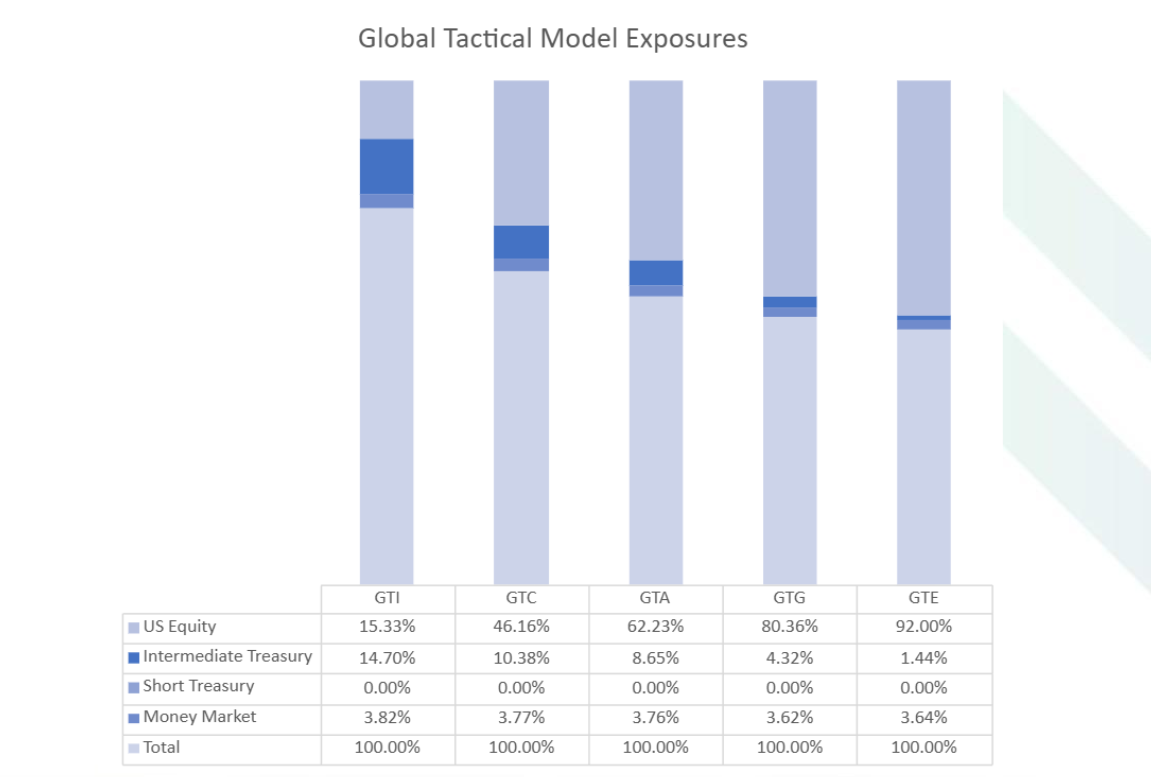
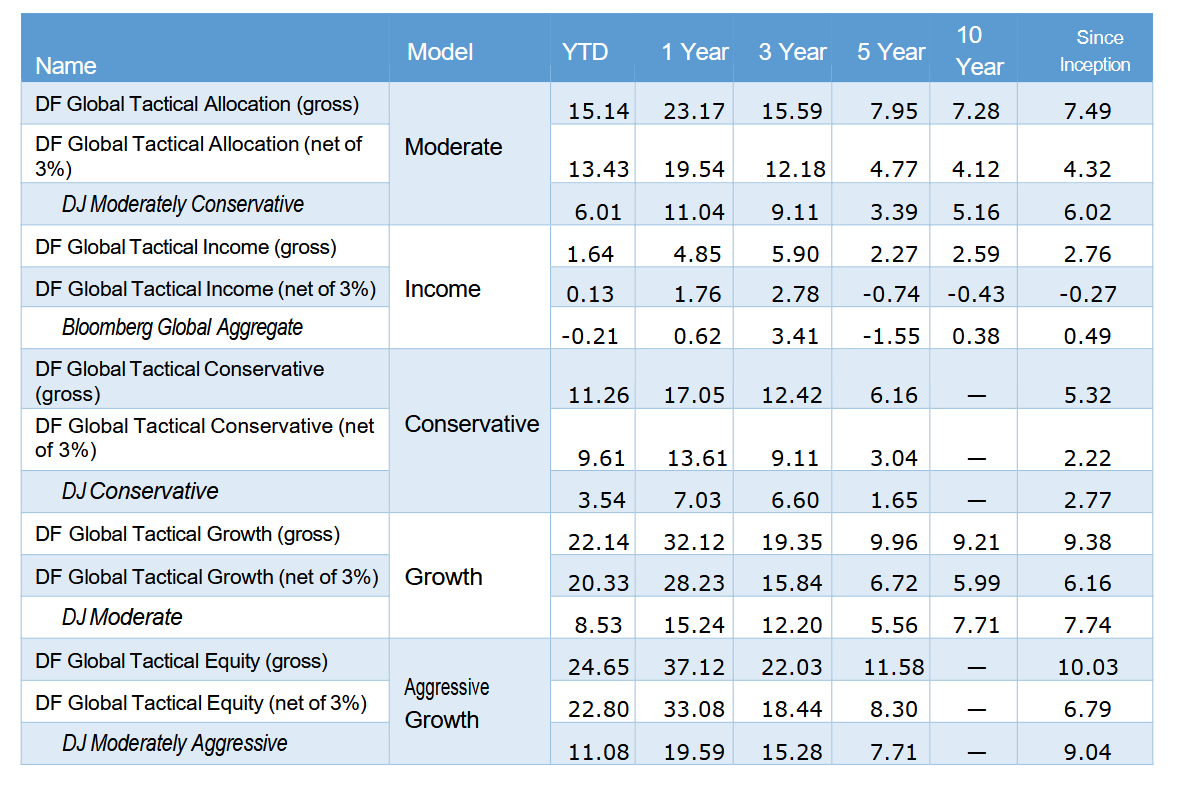
The investment committee continues to have an overall bullish viewpoint on the global markets and particularly in the U.S. We are maintaining our above-average equity exposure at this point in the 3rd quarter. The Global Tactical Portfolio suite has not had any changes in its allocations at the portfolio allocation level. During the quarter, we did reallocate within the underlying fund exposures. Our indicators turned back positive with respect to our underlying bank loan exposures as well as high yield in mid-April. In addition, we did post quarter recently reduce our duration exposure particularly in intermediate term treasuries and have shifted the underlying exposures into the short-term investment grade asset class. All of our Global Tactical Portfolios are having a strong year and are beating their benchmarks on a year-to-date basis. We will continue to monitor market trends and seek tactical opportunities to take advantage of any dislocations.
(Positioning as of 6/30/2026)
(Performance as of 6/30/2026)
Rules Based Portfolios
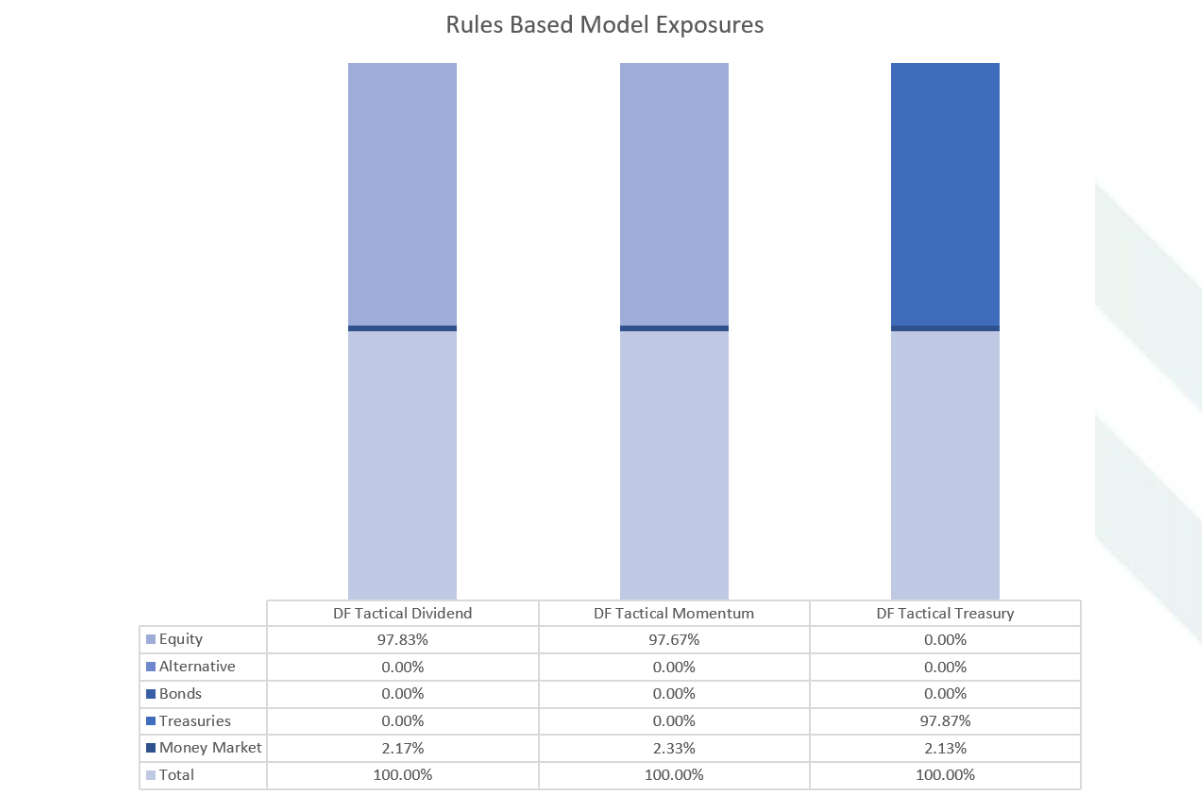
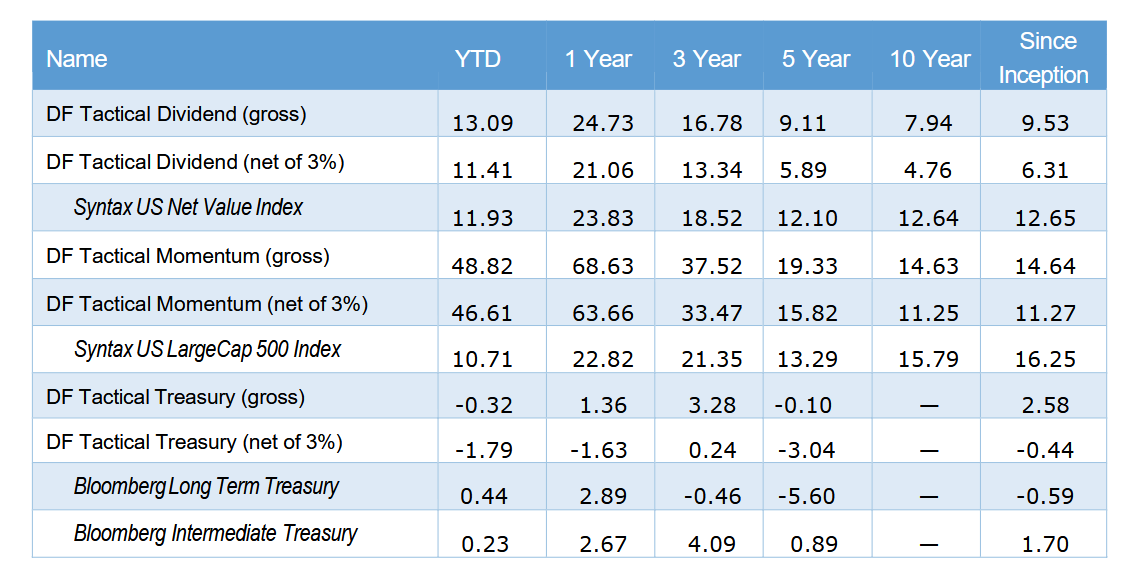
The DF Tactical Momentum and DF Tactical Dividend SMAs maintained a bullish position heading into the 2nd quarter of 2026 despite March having weakness. It should be understood that both strategies have tactical overlays that are designed to attempt to mitigate downside risk particularly in a deep recessive market environment. The signals are not designed to capture every ebb and flow and corrective pullback. Therefore, there were no defensive signals in the quarter. Both strategies outperformed their respective benchmarks. DF Tactical Momentum year to date returns were over four times its benchmark index returns. The attribution of the DF Tactical Momentum can largely be attributed to the technology sector and particularly to semiconductors and semiconductor equipment positions. Micron and Western Digital are two stocks that have very strong performance in the quarter in the strategy. Both were up in excess of 100% for the quarter. Two of the stocks that provided the largest detraction to the portfolio were Charter Communications and Exxon Mobil both down 41.5% and 18.2% respectively. The attribution of the DF Tactical Dividend strategy was generally broad based. However, leadership did come from sector weightings towards financials and healthcare. Strong performers in the DF Tactical Dividend SMA for the quarter were AbbVie Inc. and CVS Health Corp. up 15.6% and 13.7% respectively. The energy sector, which has roughly a 10% weight, was a detractor as oil prices retreated over geopolitical concerns. The two stocks which were the largest detractors for the quarter in the DF Tactical Dividend SMA were Accenture PLC and HP Inc. down 33.5% and 17.9% respectively. We would be happy to provide full portfolio details upon request.
The DF Tactical Treasury strategy did have a shift from long-term treasuries to intermediate term treasuries as our technical indicators tied to the credit asset classes had firmed.
(Positioning as of 6/30/2026)
(Performance as of 6/30/2026)
Blended Portfolios
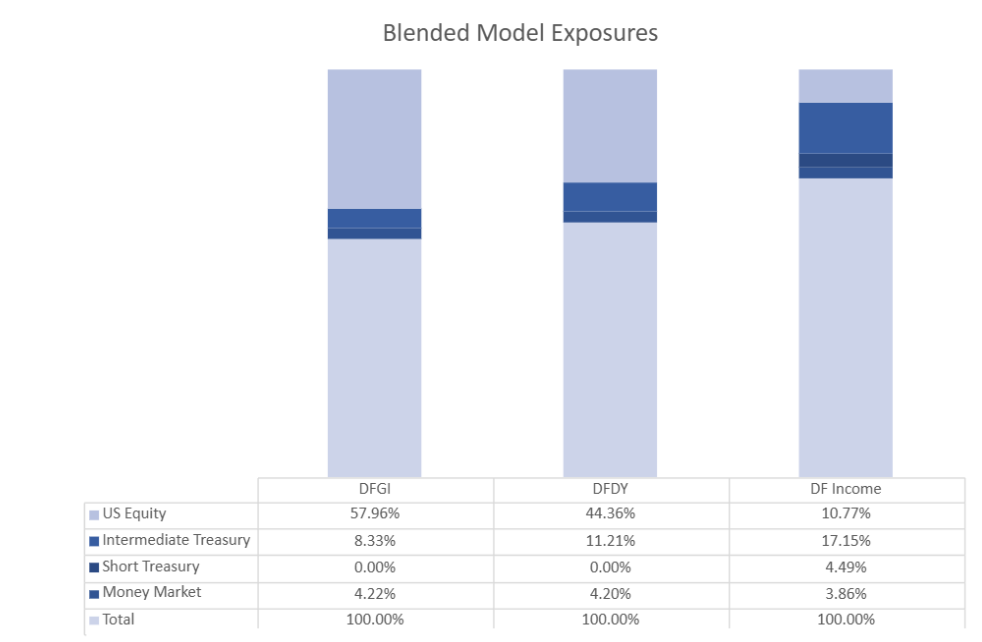
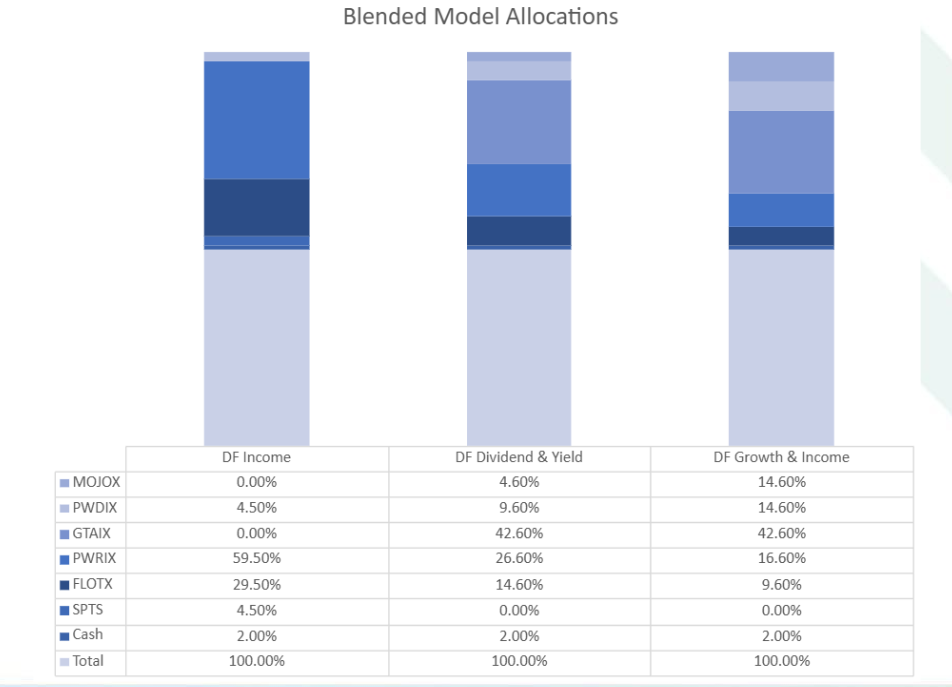
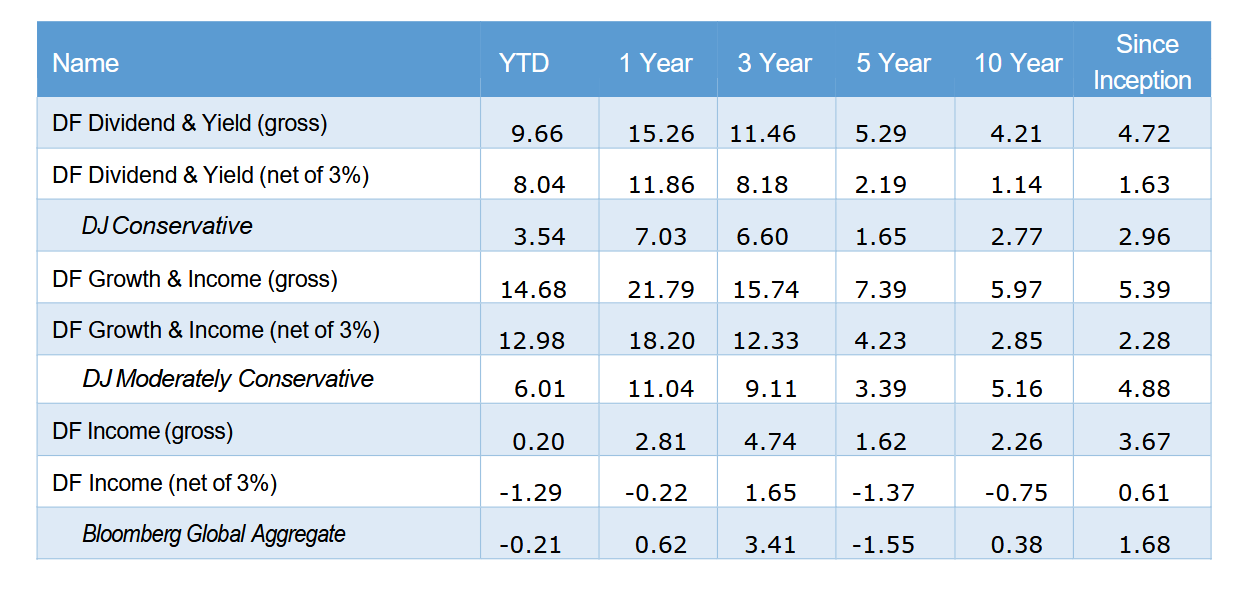
The blended portfolios combine our global macro fundamental research along with our rules based technical strategies. Currently, we are favoring U.S. equities and are tilted towards higher yielding credit with some exposure to short term investment grade bonds. The investment team will seek tactical opportunities to increase equity exposure but will also be ready to pull off risk should trends reverse.
(Positioning as of 6/30/2026)
(Performance as of 6/30/2026)
You can get more information by calling (800) 642-4276 or by emailing AdvisorRelations@donoghueforlines.com.

Regards,
Jeffrey R. Thompson
Chief Executive Officer
Important Disclosures
Past performance is no guarantee of future results. Performance prior to January 1, 2018 was earned on accounts managed at a predecessor firm, JAForlines Global. The person primarily responsible for achieving that performance continues to manage accounts at Donoghue Forlines in a substantially similar manner. The material contained herein as well as any attachments is not an offer or solicitation for the purchase or sale of any financial instrument. It is presented only to provide information on investment strategies, opportunities and, on occasion, summary reviews on various portfolio performances. The investment descriptions and other information contained in this Markets in Motion are based on data calculated by Donoghue Forlines LLC and other sources including Morningstar Direct. This summary does not constitute an offer to sell or a solicitation of an offer to buy any securities and may not be relied upon in connection with any offer or sale of securities. The views expressed are current as of the date of publication and are subject to change without notice. There can be no assurance that markets, sectors or regions will perform as expected. These views are not intended as investment, legal or tax advice. Investment advice should be customized to individual investors objectives and circumstances. Legal and tax advice should be sought from qualified attorneys and tax advisers as appropriate. The calculation and presentation of performance has not been approved or reviewed by the SEC or its staff.
The DF Global Tactical Allocation Portfolio composite was created July 1, 2009. The DF Global Tactical Income Portfolio composite was created August 1, 2014. The DF Global Tactical Growth Portfolio composite was created April 1, 2016. The DF Global Tactical Conservative Portfolio composite was created January 1, 2018. The DF Global Tactical Equity Portfolio composite was created January 1, 2018. The DF Tactical Dividend Portfolio Composite was created on January 1, 2013. The DF Tactical Treasury Portfolio was created on August 1, 2017. The DF Tactical Momentum Portfolio Composite was created March 1, 2016. The DF Dividend & Yield Portfolio Composite was created December 1, 2011. The DF Growth & Income Portfolio Composite was created January 1, 2015. The DF Income Portfolio Composite was created June 1, 2008.
Results are based on fully discretionary accounts under management, including those accounts no longer with the firm. Individual portfolio returns are calculated monthly in U.S. dollars. These returns represent investors domiciled primarily in the United States. Past performance is not indicative of future results. Performance reflects the re-investment of dividends and other earnings.
Net 3% Returns
For all portfolios, net 3% returns are presented net of a hypothetical maximum fee of three percent (3%). Actual fees applicable to an individual investor’s account will wary and no individual investor may incur a fee as high as 3%. Please consult your financial advisor for fees applicable to your account. Individual returns will vary.
Fee Schedule
The investment management fee schedule for all portfolios is: Client Assets = All Assets; Annual Fee % = 0.00%. Actual investment advisory fees incurred may vary and should be confirmed with your financial advisor.
Each portfolio includes holdings on which Donoghue Forlines may receive management fees as the advisor and/or subadvisor or from separate revenue sharing agreements. Please see the prospectuses for additional disclosures.
The investment management fee schedule for the composites is: Client Assets = All Assets; Annual Fee % = 0.00%. Actual investment advisory fees incurred may vary and should be confirmed with your financial advisor.
Investors should carefully consider the investment objectives, risks, charges, and expenses of mutual fund and ETFs. This and other information about a Fund is contained in its prospectus and should be read carefully before investing.
The DF Global Tactical Allocation Benchmark is the DJ Moderately Conservative Index. The DF Global Tactical Conservative Benchmark is the DJ Conservative Index. The DF Global Tactical Growth is the DJ Moderate Index. The DF Global Tactical Income Benchmark is the Bloomberg Tactical Aggregate Index. The DF Global Tactical Equity Benchmark is the DJ Moderately Aggressive Index. The Dow Jones Moderately Aggressive Index is a multi-asset index designed to reflect a portfolio with a moderate risk profile. it targets an 80% risk level, as measured by the downside risk of the Dow Jones Global Stock CMAC Index, over a 36-month period. This risk profile is achieved through an allocation of stocks, bonds, and cash. The Dow Jones Moderate TR Index measures the performance of returns on its total portfolios with a target risk level of moderate investors will take 60% of all stock portfolio
risk. Its portfolios include three major asset classes: stocks, bonds, and cash. The weightings are rebalanced monthly to maintain the target level. The index is a subset of the global series of the Dow Jones Relative Risk Indices. The Dow Jones Moderately Conservative portfolio index is a member of the Dow Jones Relative Risk Index Series and is designed to measure a total portfolio of stocks, bonds, and cash, allocated to represent an investor’s desired risk profile. The Dow Jones Moderately Conservative Portfolio index risk level is set to 40% of the Dow Jones Global Stock CMAC Index’s downside risk (past 36 months). The Bloomberg Global Aggregate Index is a broad-based flagship benchmark that measures the investment grade, us dollar-denominated, fixed-rate taxable bond market. The index includes Treasuries, government-related and corporate securities, fixed-rate agency MBS, ABS and CMBS (agency and non-agency).
The Syntax US Net Value Index is a type of stock market index that tracks the performance of the US equity market, specifically focusing on value-oriented companies. It measures the net asset value (NAV) of a portfolio holding large-cap US equities, typically companies that are considered value-oriented. The Syntax US LargeCap 500 Index float market cap weights the 500 largest public US companies as ranked by their float market caps, subject to rank buffers and liquidity screens. Companies are defined as US According to Syntax’s proprietary country classification methodology considering regulatory filings, currencies of accounting and distribution, and tax havens. The Bloomberg US Long Treasury Index, Bloomberg US Intermediate Treasury Index, are for comparison purposes only. Bloomberg US Long Term Treasury Index measures the performance of US treasury bonds with long term maturity. The credit level for this index is investment grade. Bloomberg US Intermediate Term Treasury Index measures the performance of US treasury notes with intermediate term maturity. The credit level for this index is investment grade.
Index performance results are unmanaged, do not reflect the deduction of transaction and custodial charges or a management fee, the incurrence of which would have the effect of decreasing indicated historical performance results. You cannot invest directly in an Index. Economic factors, market conditions and investment strategies will affect the performance of any portfolio, and there are no assurances that it will match or outperform any particular benchmark.
Policies for valuing portfolios, calculating performance, and preparing compliant presentations are available upon request. For a compliant presentation and/or the firm’s list of composite descriptions, please contact 800-642-4276 or info@donoghueforlines.com.
Donoghue Forlines LLC is a registered investment adviser with the United States Securities and Exchange Commission in accordance with the Investment Advisers Act of 1940. Registration does not imply a certain level of skill or training.